After 2021’s strong equity market return, investors may want to pump the brakes. The 28.71% return of the S&P 500® Index for 2021 is the tenth-highest annual return of the last 50 years and brought its trailing three-year cumulative return to more than 100%. Historically, volatile equity market conditions have ensued after the S&P 500® Index has returned 100% or more over a three-year period, which should raise a caution flag for investors. In nearly all cases over the last 50 yearsi, three-year periods with a return greater than 100% for the S&P 500® Index were followed by higher-than-average realized volatility, i.e. S&P 500® Index standard deviations up to 43% above normal and equity market drawdowns from 15% to 45% within the next three years.
Given the bond market’s low current yields and negative 2021 return, investors who want to be prepared for an increase in volatility may find strategies that reduce risk with index option writing to be attractive relative to using bonds to lower risk. 2021 was a strong year for option writing indexes such as the Cboe® S&P 500 BuyWriteSM Index (the BXMSM) and the Cboe®S&P 500 PutWriteSM Index (the PUTSM). Both the BXMSM and the PUTSM, generated returns of over 20% in 2021, something neither had done since 2009, while exhibiting lower standard deviation and smaller drawdowns than the S&P 500® Index. Moreover, in a year when the equity market delivered above-average return with below-average risk, both the BXMSM and the PUTSM delivered a higher risk-adjusted return than the S&P 500® Index.
The returns and risk-adjusted returns of the two option writing indexes were supported by an above-average Volatility Risk Premium (VRP), the spread between implied volatility, as measured by the Cboe Volatility Index (VIX®) and realized volatility, as measured by the standard deviation of daily returns for the S&P 500® Index. In each month of 2021, the average closing level of the VIX® exceeded realized volatility. The monthly VRP ranged from 4.33% to 9.24% and on average were more than 60% higher than the normal spread of 4.1%.
Importantly, the pricing curve for futures contracts on the VIX®, or VIX® term structure, indicates that the volatility conditions of 2021 may continue into 2022. While VIX® ended 2021 at a below-average level, the price of futures contracts with expiration dates two months or more away reflected market expectations of volatility that is significantly above-average.
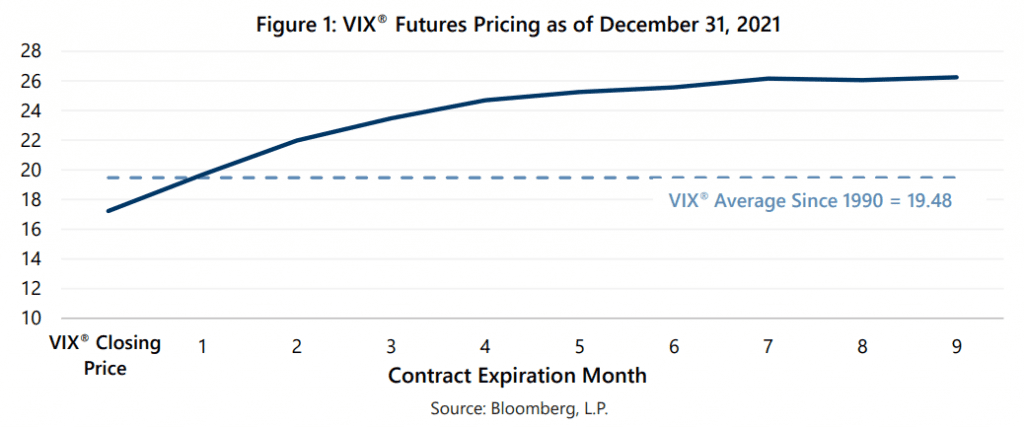
The shape of the VIX® futures curve at year-end is consistent with its shape for much of 2021–from March to December, in all but two months, the month-end closing value of the VIX® was below-average while futures contracts two months and beyond had above-average prices. The two exceptions to this were September and November, when readings were well above-average across the entire curve. While it is typical for the VIX® term structure to slope upward, it is very rare for near-term volatility pricing to be below-average while longer-term pricing is above-average. In fact, as we noted in our July 2021 Market Perspective, before VIX® term structure spent most of 2021 with that unusual steepness, it had happened less than 11% of the time over the history of the VIX® futures market, which began in 2006.
Why this unusual steepness in the VIX® term structure? We believe that the pricing of longer-dated VIX® contracts may reflect persistent intermediate-term risks such as inflation and the potential economic impact of spreading COVID variants. Meanwhile, investor responses to the changing day-to-day outlook for such risk factors produced low correlation among growth-oriented stocks and economically sensitive stocks. Below-average correlation throughout 2021 kept surface-level realized (actual) volatility low while the crosscurrents of the market churned below. The short-end of the VIX® pricing curve seems to suggest the expectation that the low correlation environment may continue in the near-term.
History suggests that market risks have a tendency to be realized after extended periods of well-above average returns. If realized volatility increases in 2022 to match or exceed the expectations reflected in VIX® futures prices, investors who are interested in alternatives to bonds for risk reduction may benefit from index option writing strategies. Gateway’s approach to benefiting from the risk reduction and risk-adjusted return enhancement that index option writing can provide combines decades of experience and flexible active management within a consistent risk framework. Gateway is uniquely positioned to assist investors seeking attractive long-term returns with less risk than equity markets and will remain vigilant, ready to respond to what lies ahead in the new year.
*Past performance is no guarantee of future results. For more information and access to additional insights from Gateway Investment Advisers, LLC, please visit www.gia.com/insights.
i: Three-year S&P 500® Index cumulative returns exceeding 100% occurred less than 7% of the time from February 1970 through December 2021. Furthermore, the 100% threshold was only exceeded twice in this millennium. The last time the three-year return reached such lofty heights was early March 2012, a three-year period that began at the bear market bottom of the Great Financial Crisis. The three years following March 2012 are exceptional relative to market conditions that ensued after the other historical occurrences. The three years after March 2012 featured an annualized return of 17.99% for the S&P 500® Index with below-average standard deviation and a maximum drawdown of just 8.36%. In contrast all other occurrences were followed by standard deviations that were 14% to 43% higher than average and maximum drawdowns between 15.37% and 44.73% within the next three years.