Is equity market volatility high or low? The answer to that question depends on where you look. Realized volatility in July, based on the annualized standard deviation of daily returns for the S&P 500® Index, was less than 12%. That’s below average. The Cboe® Volatility Index (the VIX®) averaged less than 18 in July – also below average. Investors who look no further than those two statistics may conclude that volatility is low. However, looking beyond these numbers reveals a unique opportunity for investment strategies that utilize index options with the goals of lowering risk and enhancing risk adjusted return.
Diving into sector-specific volatilities reveals that below the relatively calm surface, the equity market is more turbulent. The trailing 30-day realized volatility of each of the 11 industry sectors that comprise the S&P 500® Index simultaneously registered higher volatility than the broader index for a portion of July. While not unprecedented, this has only happened about 22% of the time over the last 10 years. The correlation, or lack thereof, across the market’s undercurrents has a significant impact on the degree to which underlying volatility rises to the surface. Not surprisingly, correlation across S&P 500® Index stocks was below average in July, as it has been over the course of 2021.
The VIX® futures curve also illustrates that the measure of volatility is a function of where you look for it. Since peaking in March 2020, the VIX® Index has declined – as can be seen in the month-end VIX® closing prices featured at the front-end of each curve in Figure 1. It was above its long-term average as 2020 came to a close but was below its long-term average at the end of June 2021 and remained below-average at the end of July 2021.
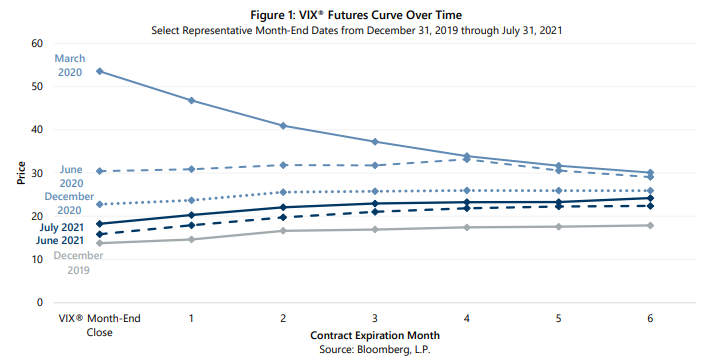
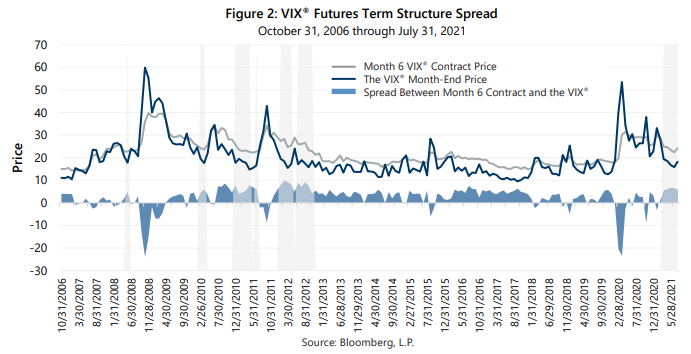
Market observers who note that implied volatility has “normalized” are often referring to the combination of the downtrend in the VIX® and the shifting VIX® futures curve from inverted in the second and third quarters of 2020 to flat at the end of 2020 and finally to its typical upward-sloping form more recently. While the term structure of implied volatility as depicted in the VIX® futures curve has “normalized”, it is not “normal.” In fact, it is quite abnormal in an important way. While it is typical for the VIX® term structure to slope upward, it is very rare for near-term volatility pricing to be below average while longer-term pricing is above average. The grey shading in Figure 2 shows that less than 11% of the time from October 2006 through February 2021, the VIX® futures term structure featured a Month 6 contract priced above average while the VIX® price was below its long-term average of 19.49. This rare steepness has now been a feature of implied volatility term structure for five consecutive months as of July 2021.
What accounts for the unusual steepness of the VIX® futures term structure? While it is difficult to know with certainty, longer-dated volatility contracts appear to reflect intermediate-term risks such as inflation and the potential economic impact of spreading COVID variants, while the short-end of the curve seems to suggest the expectation that the low correlation environment may continue in the near-term.
To the extent the term structure of implied volatility pricing is a forecast, it is rarely an accurate one. A comparison of the VIX® futures curve shape at year-end 2019 and its shape at mid-year 2020 is a stark example of how quickly it can change and how inaccurate it can be. How long current conditions may persist is unknown. Correlation relationships can change suddenly; for example, an uptick from current levels could result in a dramatic change in surface-level realized volatility and a potential rise in the VIX®. On the other hand, and the other end of implied volatility term structure, the potential impact of inflation and COVID variants may not be as significant as some investors fear. What is discernable from the study of volatility pricing is that the equity market remains highly dynamic, and that risk and uncertainty remain, even during periods of relative calm.
The shape of the VIX® futures term structure is reflected in the term structure of S&P 500® Index option prices. The current market dynamic creates potential opportunities for active index option managers who have the flexibility to shift the focus of their option writing across expirations over time. Gateway’s approach combines decades of experience in options markets and flexible active management within a consistent risk framework. Gateway is uniquely positioned to assist investors seeking attractive long-term returns with less risk than equity markets and will remain vigilant, ready to respond as market conditions change.
*For more information and access to additional insights from Gateway Investment Advisers, LLC, please visit www.gia.com/insights.