Implied volatility trended down as the market continued its rally in November. The Cboe® Volatility Index (the VIX®) ended October at 25.88, reached an intra-month high of 26.09 on November 9, then drifted to an intra-month low of 20.35 on November 23 and registered 20.58 as its final closing value of the month. This trend resulted with the VIX® averaging 23.44 for November.
Realized volatility, as measured by the standard deviation of daily returns for the S&P 500® Index exceeded implied volatility in November, registering 27.60%, more than four points higher than average implied volatility. Typically, implied volatility exceeds realized volatility. This relationship is often referred to as the volatility risk premium (VRP). Its inversion in November is notable for multiple reasons:
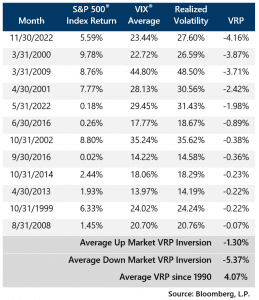
- It is rare. Over the history of the VIX®, monthly realized volatility has exceeded the monthly average for the VIX® less than 12% of the time.
- The S&P 500® Index return for November was positive. Nearly 75% of all VRP inversions have happened in months when the equity market has delivered a loss.
- It was the largest inversion for a month with a positive equity market return. VRP inversions in up market months tend to be relatively small, averaging -1.30% prior to November, while inversions in down markets average -5.37%.
- The inversion was the result of two large up days. The S&P 500® Index returned 5.55% and 3.12% on November 10 and November 30, respectively. Removing those two days from the VRP calculation results in realized volatility of 16.97% and an average VIX® of 23.58% for the month, a positive spread of 6.61%, which would be 62% higher than the historical average VRP.
November’s volatility data adds to this year’s unique market dynamics and may be further evidence of the impact of short-term index option trading strategies.