
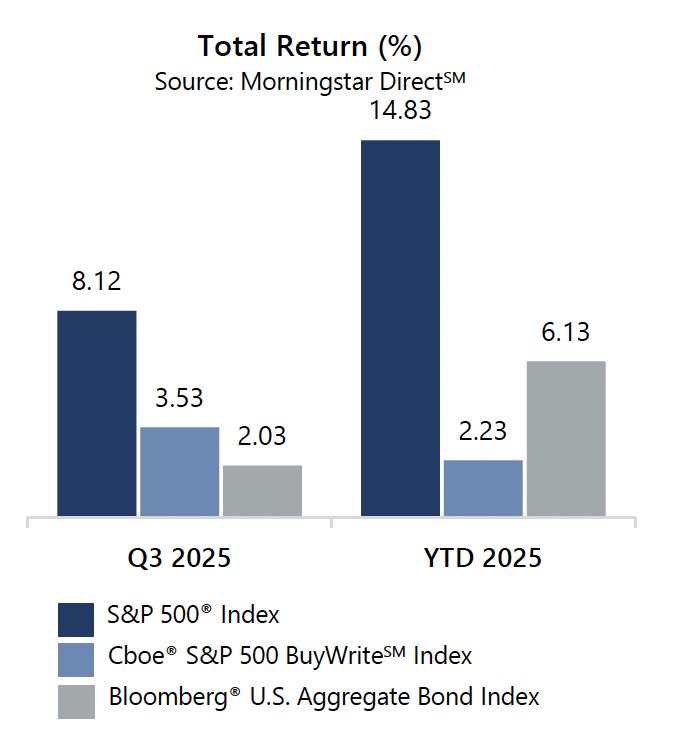
The S&P 500® Index advanced 8.12% during the third quarter of 2025, bringing its year-to-date return to 14.83%. With the tariff tantrum in the rearview mirror and the expectation of additional interest rate cuts in 2025, the S&P 500® Index reached a new all-time high on September 22 before closing its best September since 2010. The S&P 500® Index started the quarter relatively muted, climbing just 0.61% from the close of the second quarter to August 1. As the Federal Reserve began warming to the idea of an interest rate cut, the equity market advance accelerated. From August 1 through quarter-end, the S&P 500® Index advanced 7.47%.
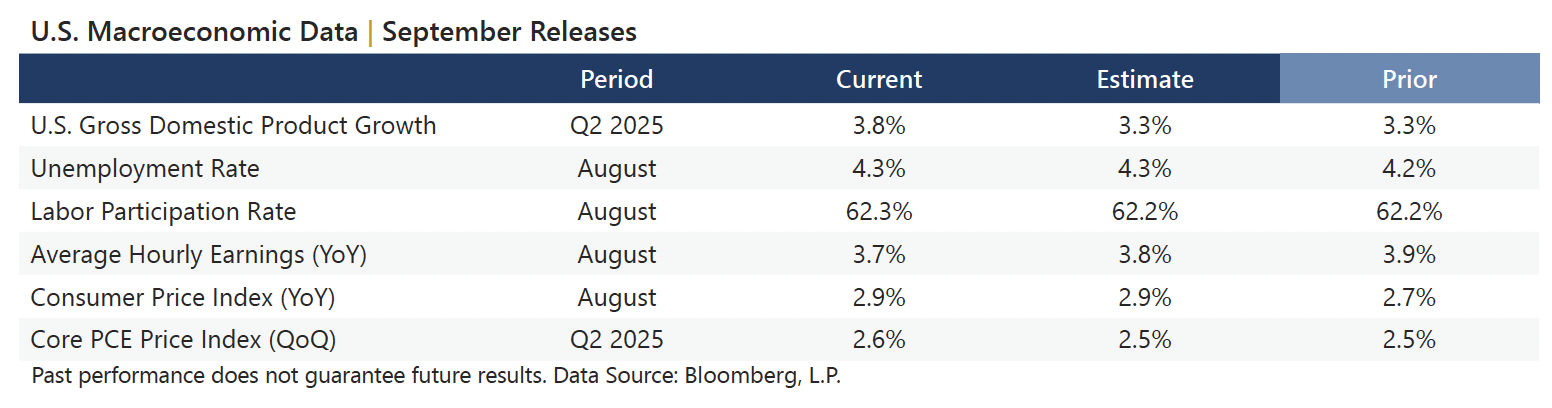
Data released in September reflected continued macroeconomic resilience with signs of steady inflation and a steady labor market. The current estimate of Gross Domestic Product for the second quarter of 2025 was increased from the prior estimate and was better than consensus expectations. The year-over-year August Consumer Price Index, released September 11, was in line with the consensus estimate and slightly higher than the prior period. The quarter-over-quarter Personal Consumption Expenditures (PCE) Price Index was higher than the consensus estimate and prior period. With nearly all S&P 500® Index companies reporting, corporate earnings are on track to be positive for the second quarter of 2025. Aggregate operating earnings increased 2.4% quarter-over-quarter and 10.4% year-over-year. More than 83% of reporting companies either met or exceeded analyst estimates.
Implied volatility, as measured by the Cboe® Volatility Index (the VIX®), averaged 15.98 in the third quarter. Consistent with its typical relationship, average implied volatility exceeded realized volatility, as measured by the standard deviation of daily returns for the S&P 500® Index, which was 8.68% for the quarter. The quarterly spread between S&P 500® Index implied and realized volatility, or the Volatility Risk Premium (VRP), was robust at 7.30% – well above the since 1990 average of 3.56%. The VIX® ended the second quarter at 16.73 before reaching an intra-quarter high of 20.38 on August 1. As the market advance accelerated, the VIX® retreated to an intra-quarter low of 14.22 on August 22 before ending the quarter at 16.28.

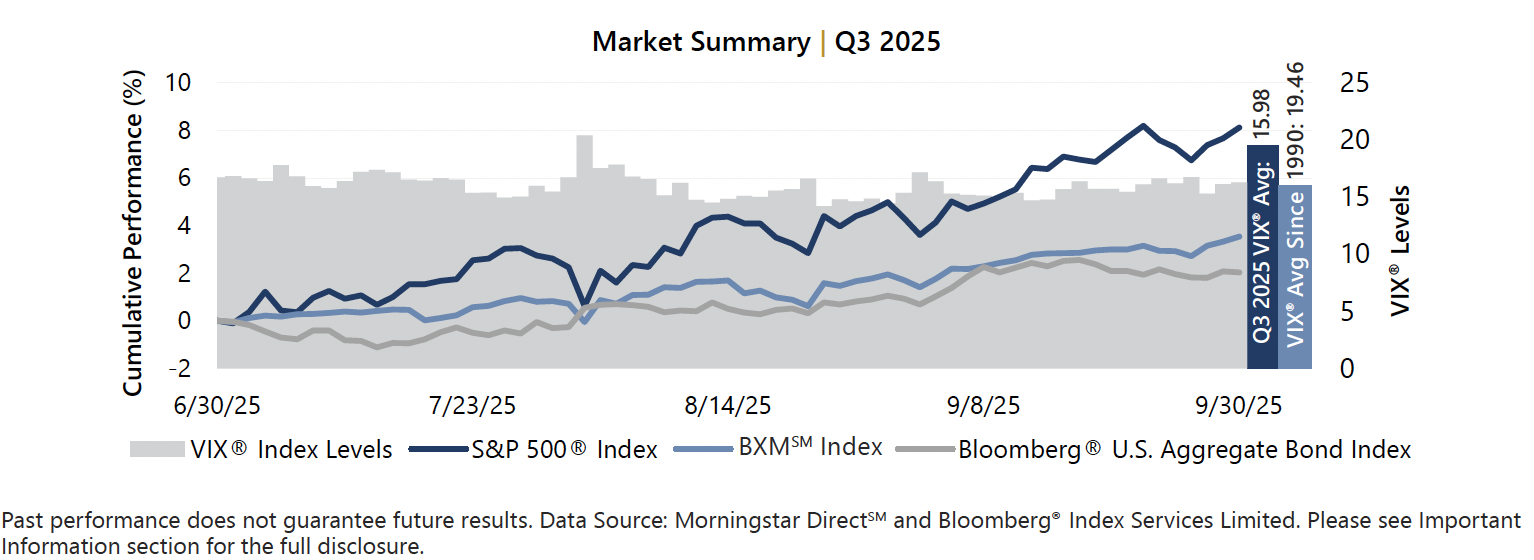
The Cboe® S&P 500 BuyWriteSM Index1 (the BXMSM) returned 3.53% in the third quarter, bringing its year-to-date return to 2.23%. The premiums the BXMSM collected as a percentage of its underlying value provided loss mitigation and are an important component of performance. The premiums the BXMSM collected as a percentage of the BXMSM’s underlying value were 1.60%, 1.61%, and 1.54% in July, August, and September, respectively. The rules-based timing of the BXMSM’s option writing and the level of premiums collected as a percentage of its underlying value contribute significantly to the BXMSM’s participation in periods of advance and its level of loss mitigation during periods of market decline.
The Bloomberg® U.S. Aggregate Bond Index returned 2.03% in the third quarter, bringing its year-to-date return to 6.13%. The yield on the 10-year U.S. Treasury Note (the 10-year) ended June at 4.23%, and hit an intra-quarter low of 4.02% on September 11 after touching an intra-quarter high of 4.48% on July 15. The 10-year ended the quarter at 4.15%.
[1] The BXMSM is a passive total return index designed to track the performance of a hypothetical buy-write strategy on the S&P 500® Index. The construction methodology of the index includes buying an equity portfolio replicating the holdings of the S&P 500® Index and selling a single one-month S&P 500® Index call option with a strike price approximately at-the-money each month on the third Friday of the standard index-option expiration cycle and holding that position until the next expiration.
Past performance does not guarantee future results. Sources: Morningstar DirectSM and Bloomberg, L.P.
BLOOMBERG® and the indices referenced herein (the “Indices”, and each such index, an “Index”) are service marks of Bloomberg Finance L.P. and its affiliates (collectively “Bloomberg”) and/or one or more third-party providers (each such provider, a “Third-Party Provider,”) and have been licensed for use for certain purposes to GATEWAY INVESTMENT ADVISERS, LLC (the “Licensee”). To the extent a Third-Party Provider contributes intellectual property in connection with the Index, such third-party products, company names and logos are trademarks or service marks, and remain the property, of such Third-Pary Provider. Bloomberg or Bloomberg’s licensors own all proprietary rights in the Bloomberg Indices. Neither Bloomberg nor Bloomberg’s licensors, including a Third-Party Provider, approves or endorses this material, or guarantees the accuracy or completeness of any information herein or makes any warranty, express or implied, as to the results to be obtained therefrom and, to the maximum extent allowed by law, neither Bloomberg nor Bloomberg’s licensors, including Third-Party Provider, shall have any liability or responsibility for injury or damages arising in connection therewith.
For more information and access to additional insights from Gateway Investment Advisers, LLC, please visit www.gia.com.