The S&P 500® Index returned 0.58% in the third quarter, bringing its year-to-date return to 15.92%. After strong monthly advances of 2.38% and 3.04% in July and August, respectively, the S&P 500® Index surrendered to a growing list of investor concerns in September and declined 4.65%, suffering its first monthly loss since January of this year. Strong corporate earnings reports helped provide resilance to the market advance during the first two months of the quarter as the S&P 500® Index quickly recovered from dips of -2.86% and -1.75% in July and August, respectively. The downside moves in July and August were driven in part by concerns over the spread of coronavirus variants and the outlook for inflation. These concerns persisted into September while investors processed the potential negative impacts of China’s second-largest property developer falling short on its debt obligations and the struggle of U.S. lawmakers to agree to terms that would avoid a government shutdown. The culmination of these concerns was a simultaneous selloff in both the equity and bond markets after the S&P 500® Index reached a year-to-date high in early September. From September 2 through quarter-end, the Bloomberg Barclays U.S. Aggregate Bond Index (the Agg) lost 0.97% as interest rates rose while the S&P 500® Index slid 4.97%, its largest peak-to-trough decline so far in 2021.
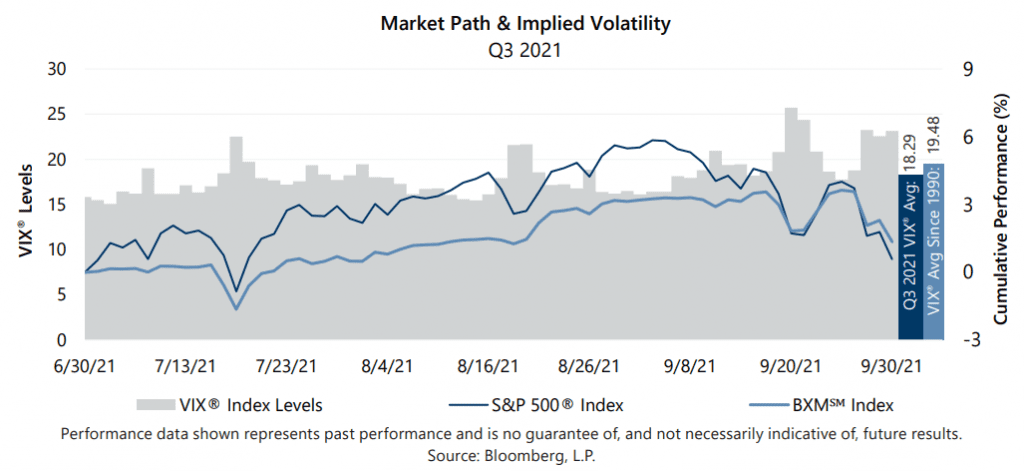
Macroeconomic data released throughout the quarter reflected a steady but cautious domestic economy as the negative effects of pandemic mitigation efforts continued to fade and investors’ sights began to shift elsewhere. The third estimate of Gross Domestic Product for the second quarter of 2021 showed that the U.S. grew at an annualized rate of 6.7%, matching the consensus expectation. The unemployment rate declined from 5.4% in July to 5.2% in August, matching the consensus expectation, while the participation rate held steady at 61.7%. Inflation matched the consensus estimate as the August Consumer Price Index, released on September 14, showed a 5.3% year-over-year increase. With over 99% of companies reporting, second quarter aggregate operating earnings were on track to climb nearly 17% quarter-over-quarter while increasing more than 40% year-over-year. More than 89% of the companies that reported earnings met or exceeded analyst estimates. Implied volatility, as measured by the Cboe® Volatility Index (the VIX®), averaged 18.29 in the third quarter of 2021. Consistent with its normal relationship, average implied volatility exceeded realized volatility, as measured by the standard deviation of daily returns for the S&P 500® Index, which was 11.16% for the quarter.
Implied volatility was generally rangebound until September when it shifted higher on an array of growing investor concerns. The VIX® began the third quarter of 2021 at 15.48, reached an intra-quarter low of 15.07 on July 2 and an intra-quarter high of 25.71 on September 20. The VIX® closed the third quarter at 23.14.
The Cboe® S&P 500 BuyWriteSM Index1 (the BXMSM) returned 1.35% in the third quarter of 2021, outperforming the S&P 500® Index by 77 basis points (bps) and bringing its year-to-date return to 12.61%. With monthly returns of 0.50%, 2.62% and -1.72% in July, August and September, respectively, the BXMSM lagged the S&P 500® Index over the first two months but downside protection during the September equity market decline was the main driver of the BXM’sSM outperformance for the quarter. On the third Friday of each month, the BXMSM writes a new index call option as the option it wrote the previous month expires. The premiums the BXMSM collects on its written index call options have significant influence on its return potential during equity market advances and help to mitigate market declines. The premiums the BXMSM collected as a percentage of the BXM’sSM underlying value were 1.39%, 1.50% and 1.54% in July, August and September, respectively. From the beginning of the quarter through September 2, the BXMSM returned 3.26%, lagging the 5.84% return of the S&P 500® Index by 258 bps, as premiums collected by the BXMSM were insufficient to keep pace with the equity market’s strong advance. During September’s equity market decline, the remaining premium collected on its call option written in August, combined with the premium received on September 17, helped provide over 300 bps of downside protection. From September 2 through September 30, the BXMSM declined 1.84% compared to the 4.97% decline of the S&P 500® Index.
The Agg returned 0.05% in the third quarter of the year, bringing its year-to-date return to -1.55%. Interest rates trended down during the beginning of the quarter but ultimately ended just slightly above the point at which they started. The yield on the 10-year U.S. Treasury Note (the 10-year) started the quarter at 1.46%, reached its intra-quarter low of 1.17% on August 3, then climbed to its intra-quarter high of 1.54% on September 28. The 10-year ended the quarter with a yield of 1.49%.
1The BXMSM is a passive total return index designed to track the performance of a hypothetical buy-write strategy on the S&P 500® Index. The construction methodology of the index includes buying an equity portfolio replicating the holdings of the S&P 500® Index and selling a single one-month S&P 500® Index call option with a strike price approximately at-the-money each month on the Friday of the standard index-option expiration cycle and holding that position until the next expiration.
Sources: Morningstar DirectSM, Bloomberg, L.P. Performance data shown represents past performance and is no guarantee of, and not necessarily indicative of, future results.
For more information and access to additional insights from Gateway Investment Advisers, LLC, please visit www.gia.com.