The S&P 500® Index returned 8.93% in the third quarter, bringing its year-to-date return to 5.57%. Over the quarter, the S&P 500® Index climbed 5.64% and 7.19% in July and August, respectively, but faced a significant drawdown in September which led to a decline of 3.80% for the month. The S&P 500® Index declined 9.52% from September 2 through September 23. The tech-heavy NASDAQ 100 fared worse with a decline of 12.76% over the same period, as the pullback was driven by losses in many of the technology companies that lead the market’s advance from April through August. Despite the September pullback, the S&P 500® Index has climbed 51.75% from its March 23 low through September 30.
Macroeconomic data showed consistent improvement from the negative effects of COVID-19 mitigation efforts. The third estimate of Gross Domestic Product for the second quarter of 2020 showed that the U.S. economy shrunk at an annualized rate of -31.4%, slightly better than the second estimate of -31.7% and within consensus range. The unemployment rate reflected ongoing economic normalization efforts and declined from 10.2% in July to 8.4% in August, outperforming consensus expectations, while the participation rate climbed to 61.7%. The August Consumer Price Index, released on September 11, showed a 1.3% year-over-year increase, above the consensus estimate of 1.2%. With over 99% of companies reporting, second quarter aggregate operating earnings were on track to decline 9.63% quarter-over-quarter and 18.93% year-over-year. More than 84% of the companies that have reported earnings met or exceeded analyst estimates.
Implied volatility, as measured by the Cboe® Volatility Index (the VIX®), averaged 25.81 in the third quarter of 2020. Consistent with its normal relationship, average implied volatility exceeded realized volatility, as measured by the standard deviation of daily returns for the S&P 500® Index, which was 16.90% for the quarter. Implied volatility generally trended down over the first half of the third quarter of 2020 before rising in September. The VIX® began the third quarter of 2020 at 28.62 before dipping to an intra-quarter low of 21.35 on August 17. The VIX® then climbed to its third quarter high of 33.60 on September 3 before closing at 26.37, well above its historical average of 19.42.
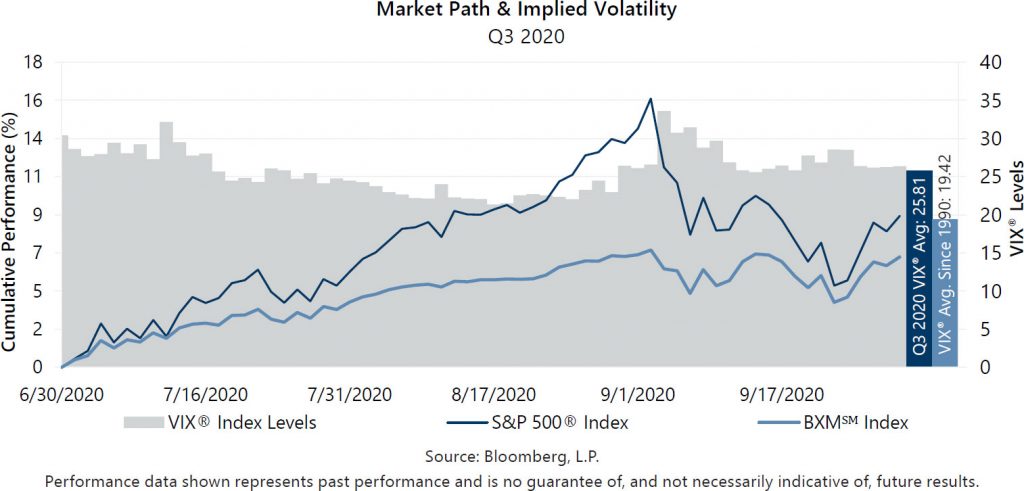
The Cboe® S&P 500 BuyWriteSM Index1 (the BXMSM) returned 6.52% in the third quarter of 2020, underperforming the S&P 500® Index by 241 basis points (bps) and bringing its year-to-date return to -9.58%. On the third Friday of each month, the BXMSM writes a new index call option as the option it wrote the previous month expires. The premiums the BXMSM collects on its written index call options have significant influence on its return potential during market advances and help to mitigate market declines. Premiums collected as a percentage of the BXM’sSM underlying value were 2.59%, 1.76% and 2.16% in July, August and September, respectively. With monthly returns of 3.85%, 2.59% and -0.02% for July, August and September, respectively, strong downside protection from the BXMSM in September did not make up for significant underperformance in August, resulting in underperformance for the quarter. Underperformance in August was primarily due to the premiums collected by the BXMSM in July and August providing insufficient return potential to keep pace with the S&P 500® Index’s rapid advance. The equity market’s 7.19% return in August put the BXM’sSM September expiration index call option deep in-the-money, resulting in very low market exposure when the market peaked on September 2. The written call option thus provided significant downside protection during the first leg of the equity market selloff. From the beginning of the month through September 18, the expiration date of its option, the BXMSM declined 1.10% while the S&P 500® Index fell 5.08%. The premium collected when the BXMSM wrote its new index call option with an October expiration provided downside protection as the equity market continued to decline through September 23 and allowed for participation in the equity market advance over the last week of September. From September 18 through month-end, the BXMSM returned 1.10% while the S&P 500® Index returned 1.35%.
The Bloomberg Barclays U.S. Aggregate Bond Index returned 0.62% in the third quarter of 2020, bringing its year-to-date return to 6.79%. The yield on the 10-year U.S. Treasury Note (the 10-year) started the quarter at 0.68% and reached an intra-quarter low of 0.51% on August 4 before climbing to an intra-quarter high of 0.75% on August 27. The yield on the 10-year then drifted lower to close the quarter at 0.68%.
1The BXMSM is a passive total return index designed to track the performance of a hypothetical buy-write strategy on the S&P 500® Index. The construction methodology of the index includes buying an equity portfolio replicating the holdings of the S&P 500® Index and selling a single one-month S&P 500® Index call option with a strike price approximately at-the-money each month on the Friday of the standard index-option expiration cycle and holding that position until the next expiration.