The S&P 500® Index returned -2.66% for the month of October, bringing its year-to-date return to 2.77%. The equity market decline was driven by uncertainty around fiscal stimulus and a resurgence of concern regarding COVID-19. During the beginning of October, slight progress in negotiations on a second economic stimulus bill helped the S&P 500® Index return 5.15% from October 1 through October 12. As discussions deteriorated and COVID-19 case counts increased, the S&P 500® Index declined 7.43% from October 12 through month-end.
Macroeconomic data reflected an ongoing recovery from the negative effects of COVID-19 mitigation efforts. The first estimate of Gross Domestic Product for the third quarter of 2020 showed that the U.S. grew at an annualized rate of 33.1%, much better than the consensus estimate of 30.9%. The unemployment rate reflected ongoing economic normalization efforts and declined from 8.4% in August to 7.9% in September, beating consensus expectations, while the participation rate declined to 61.4%. The September Consumer Price Index, released on October 13, showed a 1.4% year-over-year increase, in line with consensus estimates. With nearly 63% of companies reporting, third quarter aggregate operating earnings were on track to decline 3.83% quarter-over-quarter and 21.24% year-over-year. More than 88% of the companies that have reported earnings met or exceeded analyst estimates.
Implied volatility, as measured by the Cboe® Volatility Index (the VIX®), averaged 29.44 in October 2020. Consistent with its normal relationship, average implied volatility exceeded realized volatility, as measured by the standard deviation of daily returns for the S&P 500® Index, which was 20.90% for the month. The spread between the two statistics was more than double the average monthly differential since 1990. The VIX® opened the month at 26.70 before dipping to an intra-month low of 25.00 on October 9 as the equity market climbed in the beginning of the month. The VIX® then reached an intra-month high of 40.28 on October 28 before closing the month at 38.02. The VIX® remained significantly above its historical average of 19.45 throughout the month.
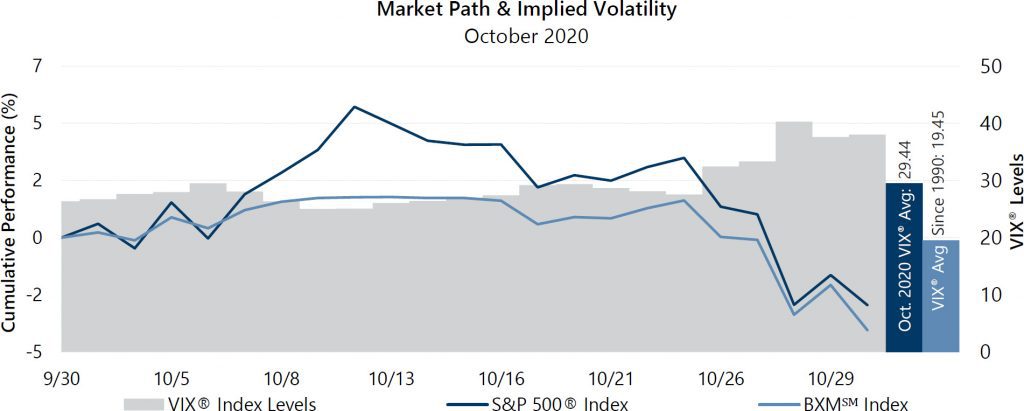
The Cboe® S&P 500 BuyWriteSM Index1 (the BXMSM) returned -3.64% in October, underperforming the S&P 500® Index by 98 basis points (bps) and bringing its year-to-date return to -12.87%. On the third Friday of each month, the BXMSM writes a new index call option as the option it wrote the previous month expires. The premiums the BXMSM collects on its written index call options have significant influence on its return potential during market advances and help to mitigate market declines. The BXM’sSM underperformance relative to the S&P 500® Index was primarily due to the premium collected by the BXMSM when it wrote its index call option on September 18 providing insufficient return potential to keep pace with the equity market’s rapid advance at the beginning of October. Specifically, the BXMSM generated a return of 1.45% from the beginning of October through October 16 as it earned the remaining time premium from the index call option it wrote in September. However, this was insufficient to keep pace with the 3.67% advance of the S&P 500® Index over the same period. On October 16, the BXMSM wrote a new index call option with a November expiration and collected a premium of 2.58% as a percentage of the BXM’sSM underlying value. The time premium earned as the market declined provided 108 bps of downside protection as the equity market declined 6.10% from its closing value on October 16 through month-end. The BXMSM returned -5.02% over the same period.
The Bloomberg Barclays U.S. Aggregate Bond Index returned -0.45% in October, bringing its year-to-date return to 6.32%. The yield on the 10-year U.S. Treasury Note started October at its intra-month low of 0.68% before before ending at an intra-month high of 0.87%.
1The BXMSM is a passive total return index designed to track the performance of a hypothetical buy-write strategy on the S&P 500® Index. The construction methodology of the index includes buying an equity portfolio replicating the holdings of the S&P 500® Index and selling a single one-month S&P 500® Index call option with a strike price approximately at-the-money each month on the Friday of the standard index-option expiration cycle and holding that position until the next expiration.