The S&P 500® Index returned 6.17% in the first quarter of 2021. With monthly returns of -1.01%, 2.76% and 4.38% for January, February and March, respectively, the advance came in fits and starts with nearly all of the first quarter return generated after March 4. After January’s decline, the S&P 500® Index climbed 6.01% through February 12 on positive-trending developments surrounding COVID-19 paired with growing prospects for additional fiscal stimulus. Over the second half of February, increasing concerns over rising interest rates and the outlook for inflation gripped investors and the S&P 500® Index fell 4.13% from February 12 through March 4. Congress passed a new economic stimulus package in early March and the S&P 500® Index returned 5.53% from March 4 through quarter-end.
Macroeconomic data released throughout the quarter reflected stabilization and recovery as the pandemic mitigation restrictions continued to ease in the U.S. The third estimate of Gross Domestic Product for the fourth quarter of 2020 showed that the U.S. grew at an annualized rate of 4.3%, beating the consensus expectation. The decline in unemployment rate was also better than expected as it came in at 6.2% for February, while the participation rate held steady at 61.4%. The February Consumer Price Index, released on March 10, showed a 1.7% year-over-year increase which was in line with the consensus estimate. With over 99% of companies reporting, fourth quarter aggregate operating earnings were on track to decline 0.80% quarter-over-quarter and 22.11% year-over-year. More than 80% of the companies that reported earnings met or exceeded analyst estimates.
Implied volatility, as measured by the Cboe® Volatility Index (the VIX®), averaged 23.20 in the first quarter of 2021. Average implied volatility was significantly higher than realized volatility, as measured by the standard deviation of daily returns for the S&P 500® Index, which was 15.86% for the quarter. The VIX® opened the quarter at 26.97, climbed to an intra-quarter high of 37.21 on January 27, then drifted to an intra-quarter low of 18.86 on March 26. The VIX® closed the quarter at 19.40.
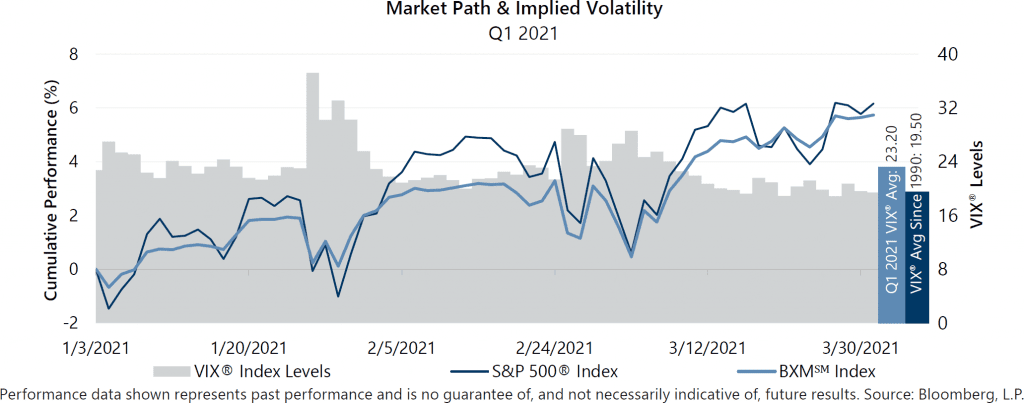
The Cboe® S&P 500 BuyWriteSM Index1 (the BXMSM) returned 5.73% in first quarter of 2021, underperforming the S&P 500® Index by 44 basis points (bps). With monthly returns of 0.11%, 1.04% and 4.53% in January, February and March, respectively, the BXM’sSM outperformance in January and March could not compensate for its underperformance in February. On the third Friday of each month, the BXMSM writes a new index call option as the option it wrote the previous month expires. The premiums the BXMSM collects on its written index call options have significant influence on its return potential during equity market advances and help to mitigate market declines. The premiums the BXMSM collected as a percentage of the BXM’sSM underlying value were 2.44%, 1.60% and 1.74% in January, February and March, respectively. The decline in premiums reflects the decrease in implied volatility over the course of the quarter. Underperformance for the quarter was primarily due to the BXM’sSM lagging return during the first half of February. The equity market decline at the end of January left the BXM’sSM written index call option out-of-the-money, which increased its market exposure. This positioning, combined with the premium it collected in January, contributed to the BXM’sSM return of 3.06% from February 1 through February 18, the day prior to the expiration of its February call option. The S&P 500® Index returned 5.48% over the same period, outperforming the BXMSM by 242 bps.
The Bloomberg Barclays U.S. Aggregate Bond Index (the Agg) declined 3.37% in the first quarter of the year as interest rates ticked higher. It was the Agg’s worst quarterly return since the third quarter of 1981. The yield on the 10-year U.S. Treasury Note (the 10-year) started the year at its intra-quarter low of 0.91% before beginning its climb to a quarterly high and first quarter close of 1.74% – a level not seen since January 2020.
1The BXMSM is a passive total return index designed to track the performance of a hypothetical buy-write strategy on the S&P 500® Index. The construction methodology of the index includes buying an equity portfolio replicating the holdings of the S&P 500® Index and selling a single one-month S&P 500® Index call option with a strike price approximately at-the-money each month on the Friday of the standard index-option expiration cycle and holding that position until the next expiration.