Despite advancing 2.73% from the start of the year through January 25, the S&P 500® Index declined 1.01% for the month. Growing concerns over the deteriorating prospects for a sizable economic stimulus package paired with volatility caused by investor speculation in stocks with high levels of short interest drove the S&P 500® Index to a decline of 3.64% over the last four trading days of the month.
Macroeconomic data released in January reflected a pause from recent positive trends. The first estimate of Gross Domestic Product for the fourth quarter of 2020 showed that the U.S. grew at an annualized rate of 4.0%, slightly below the consensus expectation. The unemployment rate held at 6.7% from November to December, barely behind the consensus expectation, while the participation rate remained at 61.5%. The December Consumer Price Index, released on January 13, showed a 1.4% year-over-year increase, slightly above the consensus estimate. With 36% of companies reporting, fourth quarter aggregate operating earnings were on track to decline 1.62% quarter-over-quarter and 22.75% year-over-year. More than 84% of the companies that have reported earnings met or exceeded analyst estimates.
Implied volatility, as measured by the Cboe® Volatility Index (the VIX®), averaged 24.91 in January. Consistent with its normal relationship, average implied volatility exceeded realized volatility, as measured by the standard deviation of daily returns for the S&P 500® Index, which was 17.05% for the month. The VIX® opened the month at 26.97, dipping to its intra-month low of 21.32 on January 21 during the equity market advance. As the market declined at the end of January, the VIX® reached an intra-month high of 37.21 on January 27 before closing the month at 33.09. The VIX® remained above its historical average of 19.49 throughout the month.
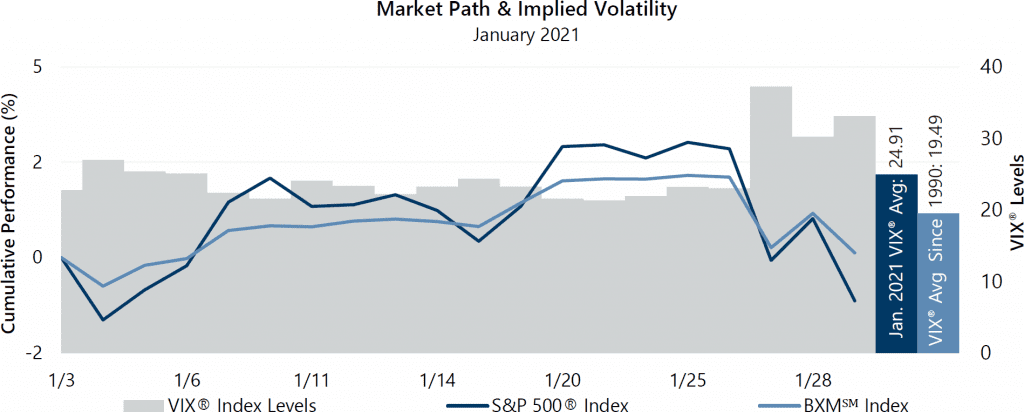
The Cboe® S&P 500 BuyWriteSM Index1 (the BXMSM) advanced 0.11% in January, outperforming the S&P 500® Index by 112 basis points (bps). On the third Friday of each month, the BXMSM writes a new index call option as the option it wrote the previous month expires. The premiums the BXMSM collects on its written index call options have significant influence on its return potential during market advances and help to mitigate market declines. Outperformance relative to the S&P 500® Index in January was primarily due to the downside protection provided by the premium collected when writing a new index call option upon the BXM’sSM January index call option expiration. From the beginning of the month through January 14, the BXMSM returned 0.85%, underperforming the 1.12% return of the S&P 500® Index by 27 bps. On January 15, the BXMSM wrote a new index call option with a February expiration and collected a premium of 2.44% as a percentage of the BXM’sSM underlying value. From its closing value on January 14 through month end, the BXMSM declined 0.73% while the S&P 500® Index declined 2.10%.
The Bloomberg Barclays U.S. Aggregate Bond Index returned -0.72% in January. The yield on the 10-year U.S. Treasury Note (the 10-year) started January at its intra-month low of 0.91% before climbing to an intra-month high of 1.15% on January 11. The yield on the 10-year closed the month at 1.07%.
1The BXMSM is a passive total return index designed to track the performance of a hypothetical buy-write strategy on the S&P 500® Index. The construction methodology of the index includes buying an equity portfolio replicating the holdings of the S&P 500® Index and selling a single one-month S&P 500® Index call option with a strike price approximately at-the-money each month on the Friday of the standard index-option expiration cycle and holding that position until the next expiration.