The S&P 500® Index returned 3.04% for the month of August, bringing its year-to-date return to 21.58%. Despite concerns over the spread of coronavirus variants and a rapid collapse of the Afghanistan government triggered by the withdrawal of U.S. military personnel, the S&P 500® Index was propelled to its seventh positive month in a row, due in part to strong aggregate operating earnings reports.
Macroeconomic data released in August reflected a resumption in positive U.S. trends despite refreshed concern regarding the potential negative economic effects of pandemic mitigation efforts in light of coronavirus variant emergence. The second estimate of Gross Domestic Product for the second quarter of 2021 showed that the U.S. grew at an annualized rate of 6.6%, matching the consensus expectation. The unemployment rate declined from 5.9% in June to 5.4% in July, below the consensus expectation of 5.7%, while the participation rate ticked up to 61.7%. Breaking a streak of above-estimate readings, inflation came in slightly below expectations as the July Consumer Price Index, released on August 11, showed a 5.4% year-over-year increase compared to the consensus estimate of 5.5%. With over 97% of companies reporting, second quarter aggregate operating earnings were on track to climb nearly 17% quarter-over-quarter while increasing more than 40% year-over-year. More than 89% of the companies that reported earnings met or exceeded analyst estimates.
Implied volatility, as measured by the Cboe® Volatility Index (the VIX®), averaged 17.47 in August. Consistent with its normal relationship, average implied volatility exceeded realized volatility, as measured by the standard deviation of daily returns for the S&P 500® Index, which was 8.21% for the month. The nine-percentage-point spread between S&P 500® Index realized volatility and average implied volatility, often referred to as the Volatility Risk Premium (VRP), was more than double the historical monthly average in August. The VIX® opened the month at 19.46 before reaching its intra-month low of 15.45 on August 13. The VIX® then climbed to an intra-month high of 21.67 on August 19 before closing the month at 16.48.
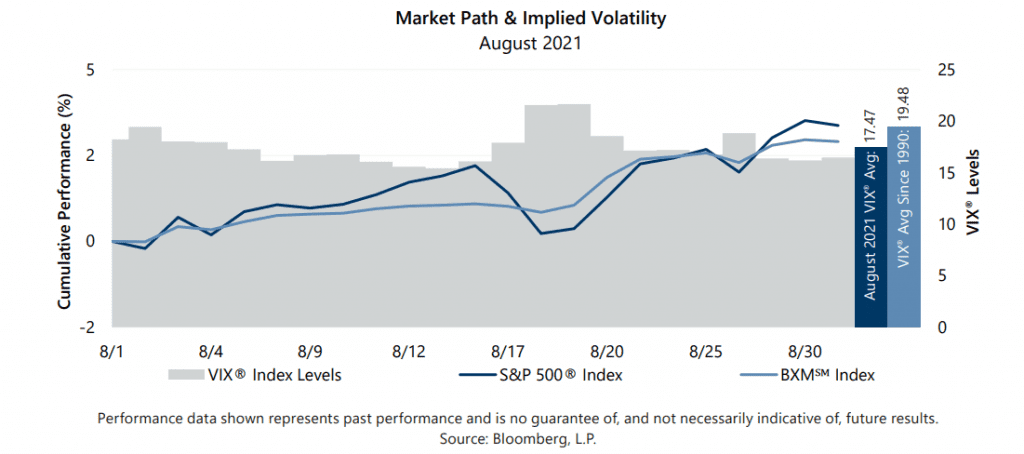
The Cboe® S&P 500 BuyWriteSM Index1(the BXMSM) returned 2.62% in August, underperforming the S&P 500® Index by 42 basis points (bps) and bringing its year-to-date return to 14.58%. The BXMSM provided downside protection during the very brief mid-month drawdown, but premiums collected in July and August were insufficient for keeping pace during the rapid equity market advances that began and ended August. On the third Friday of each month, the BXMSM writes a new index call option as the option it wrote the previous month expires. The premiums the BXMSM collects on its written index call options have significant influence on its return potential during market advances and help to mitigate market declines. As the market advanced from the beginning of the month through August 16, the BXMSM earned the remaining portion of time premium from the index call option it wrote in July, which helped it generate a return of 0.99% for the period, underperforming the S&P 500® Index by 100 bps. During the market pullback from August 16 through August 18, the BXMSM returned -0.22%, delivering downside protection and outperforming the S&P 500® Index by 153 bps. The downside protection was primarily a result of having an in-the-money index call option at the beginning of the pullback due to the strong market advance over the first two weeks of the month. From August 18 through month-end, the BXMSM returned 1.85% as it earned a portion of the premium it received on August 20, when it wrote a new index call option with a September expiration. The BXMSM lagged the 2.83% return of the S&P 500® Index by 98 bps over the same period.
The Bloomberg Barclays U.S. Aggregate Bond Index returned -0.19% in August, bringing its year-to-date return to -0.69%. The yield on the 10-year U.S. Treasury Note (the 10-year) started August at 1.18% before drifting to an intra-month low of 1.17% on August 3. The yield on the 10-year then climbed to its intra-month high of 1.36% on August 12 before closing the month at 1.31%.
1The BXMSM is a passive total return index designed to track the performance of a hypothetical buy-write strategy on the S&P 500® Index. The construction methodology of the index includes buying an equity portfolio replicating the holdings of the S&P 500® Index and selling a single one-month S&P 500® Index call option with a strike price approximately at-the-money each month on the Friday of the standard index-option expiration cycle and holding that position until the next expiration.
Sources: Morningstar DirectSM, Bloomberg, L.P. Performance data shown represents past performance and is no guarantee of, and not necessarily indicative of, future results.
For more information and access to additional insights from Gateway Investment Advisers, LLC, please visit www.gia.com.