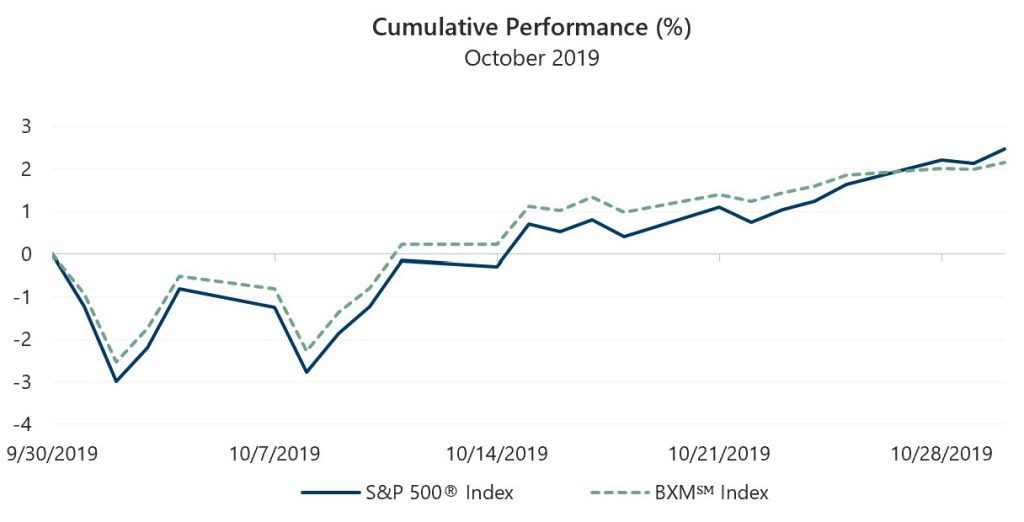
The S&P 500® Index returned 2.17% in October, oscillating over the first several days of the month before resuming its steady upward march after October 8. The S&P 500® Index returned -2.78% from the beginning of the month through October 8 and 5.09% from its closing value on October 8 through month-end. The year-to-date return of the S&P 500® Index at the end of October was 23.16%.
Entering the month of October, ongoing concerns around trade and growth led to expectations of a spooky month for equity markets. However, a relatively stable macroeconomic environment, progress around Brexit and a “phase one” agreement on trade between the U.S. and China helped keep the fright at bay.
Domestic data released during the month reflected a resilient economy which gave investors respite from heightened recession fears. The first estimate of Gross Domestic Product growth for the third quarter of 2019 was 1.9%, at the high end of consensus expectations and slightly less than the 2.0% growth rate witnessed in second quarter of 2019. The unemployment rate declined from 3.7% to 3.5% in September, below consensus expectations, with nonfarm payroll growth holding steady. With just over 67% of companies reporting, third quarter corporate earnings growth appeared to be on track for a pause. Aggregate operating earnings declined nearly 1% quarter-over-quarter while maintaining a positive growth rate of nearly 2% year-over-year. However, earnings have generally been better than expected with over 82% of these companies reporting meeting or exceeding analyst estimates. The September Consumer Price Index, released on October 10, showed a 1.7% year-over-year increase, towards the bottom of consensus expectations.
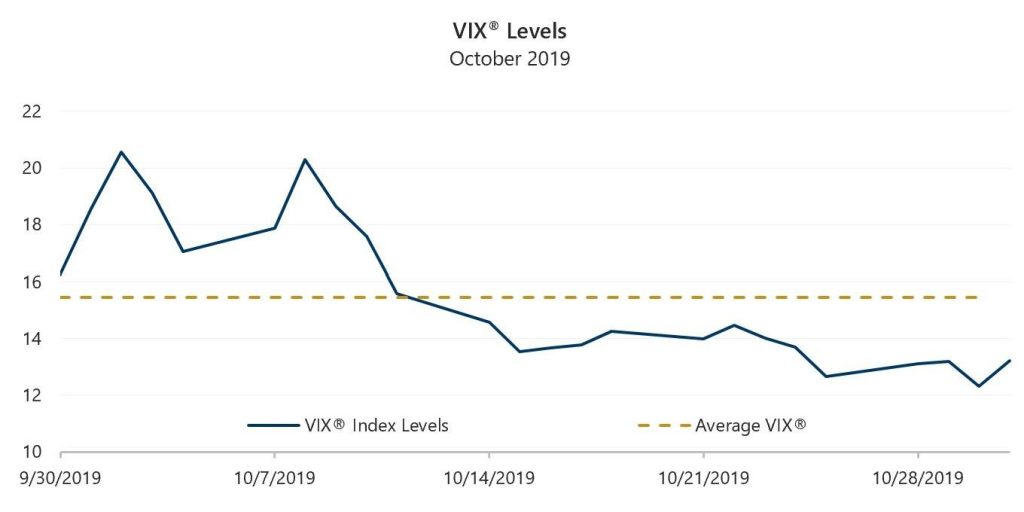
Implied volatility, as measured by the Cboe® Volatility Index (the VIX®), exceeded realized volatility and averaged 15.47 in October, while the standard deviation of daily returns for the S&P 500® Index was 13.11%. The VIX® opened the month at 18.56, peaked at 20.56 on October 2, then drifted to an intra-month low of 12.33 on October 30. The VIX® closed the month at 13.22.
Source: Bloomberg, L.P.
The Cboe® S&P 500 BuyWriteSM Index (the BXMSM) returned 2.06% in October, bringing its year-to-date return to 13.17%. On the third Friday of each month, the BXMSM writes a new index call option as the option it wrote the previous month expires. The premium the BXMSM collected on its written index call option in September helped mitigate market declines in early October. The premium collected as a percentage of the BXM’sSM underlying value was 1.11% for the month, which assisted in providing 50 basis points (bps) of downside protection relative to the S&P 500® Index during the September 30 to October 8 drawdown. With the strike price of its written index call option out-of-the-money after the market’s decline, the BXMSM had full participation in the market’s advance from October 8 through October 17, the day prior to the expiration of the index call option it wrote in September. The BXMSM returned 3.71% while the S&P 500® Index returned 3.68% from October 8 through 17. The new index call option the BXMSM wrote on October 18 with a November expiration generated a premium of 1.17% and helped the BXMSM return 0.71% from its closing value on October 17 through month-end, however, the BXMSM lagged the 1.35% return of the S&P 500® Index over the same period.
Source: Bloomberg, L.P.
Performance data shown represents past performance and is no guarantee of, and not necessarily indicative of, future results.
The Bloomberg Barclays U.S. Aggregate Bond Index returned 0.30% in October, bringing its year-to-date return to 8.85%. The yield on the 10-year U.S. Treasury Note (the 10-year) started the month at 1.64% before reaching an intra-month low of 1.53% on October 8. The yield on the 10-year then climbed to an intra-month high of 1.84% on October 28 and 29 before it closed the month at 1.69%. The yield curve steepened over the course of October as the spread between the yield of the 2-year U.S. Treasury Note and the 10-year widened from nine bps at the start of October to 17 bps at month-end.
1The BXMSM is a passive total return index designed to track the performance of a hypothetical buy-write strategy on the S&P 500® Index. The construction methodology of the index includes buying an equity portfolio replicating the holdings of the S&P 500® Index and selling a single one-month S&P 500® Index call option with a strike price approximately at-the-money each month on the Friday of the standard index-option expiration cycle and holding that position until the next expiration.