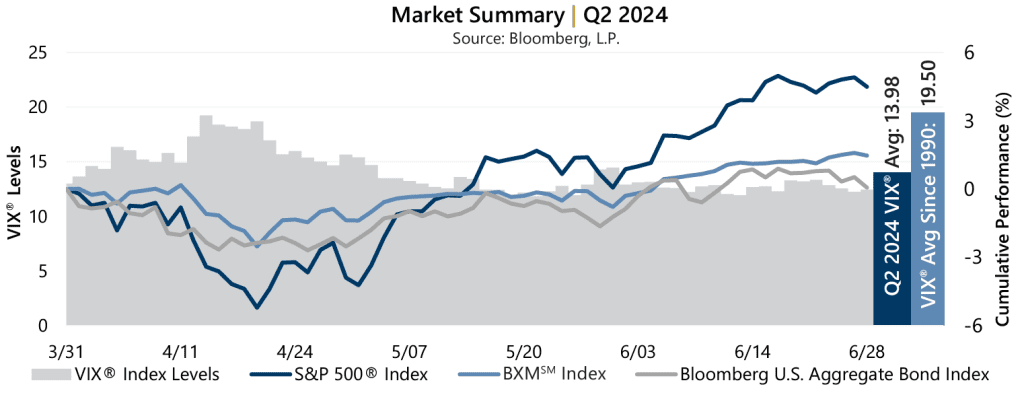
 With returns of -4.08%, 4.96%, and 3.59% in April, May, and June, respectively, the second quarter of 2024 started with a slump as the euphoria of an expected half dozen rate cuts fizzled out like soggy fireworks. April was the equity market’s first monthly decline since October 2023 and included the new year-to-date 2024 maximum drawdown of -5.40% from the end of March through April 19. U.S. Federal Reserve (the Fed) activity weighed on investors’ minds throughout the remainder of the quarter, but a slow acceptance of normalized interest rates, along with an artificial intelligence technology boom, fueled the 10.24% advance from April 19 through quarter-end and a new all-time high for the S&P 500® Index.
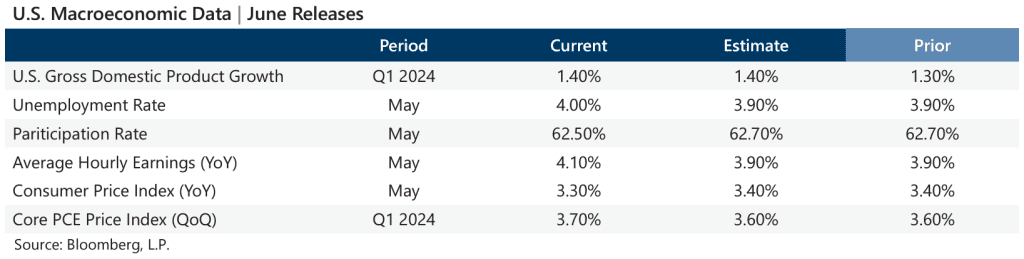
Data released in June showed a stable macroeconomic backdrop and stubborn inflation, supporting the Fed’s case to hold steady with current rates. The third estimate of Gross Domestic Product for the first quarter of 2024 matched the consensus estimate, though a slight improvement from the prior estimate. The year-over-year May Consumer Price Index, released June 12, was slightly lower than the previous reading and consensus estimates although the quarter-over-quarter Personal Consumption Expenditures (PCE) Price Index, the Fed favorite, showed an increase from the prior reading and was above consensus expectations. Corporate earnings stayed positive with first quarter aggregate operating earnings climbing 1.0% quarter-over-quarter and 7.7% year-over-year. With now over 99% of S&P 500® Index companies reporting, 82% met or exceeded analyst estimates.
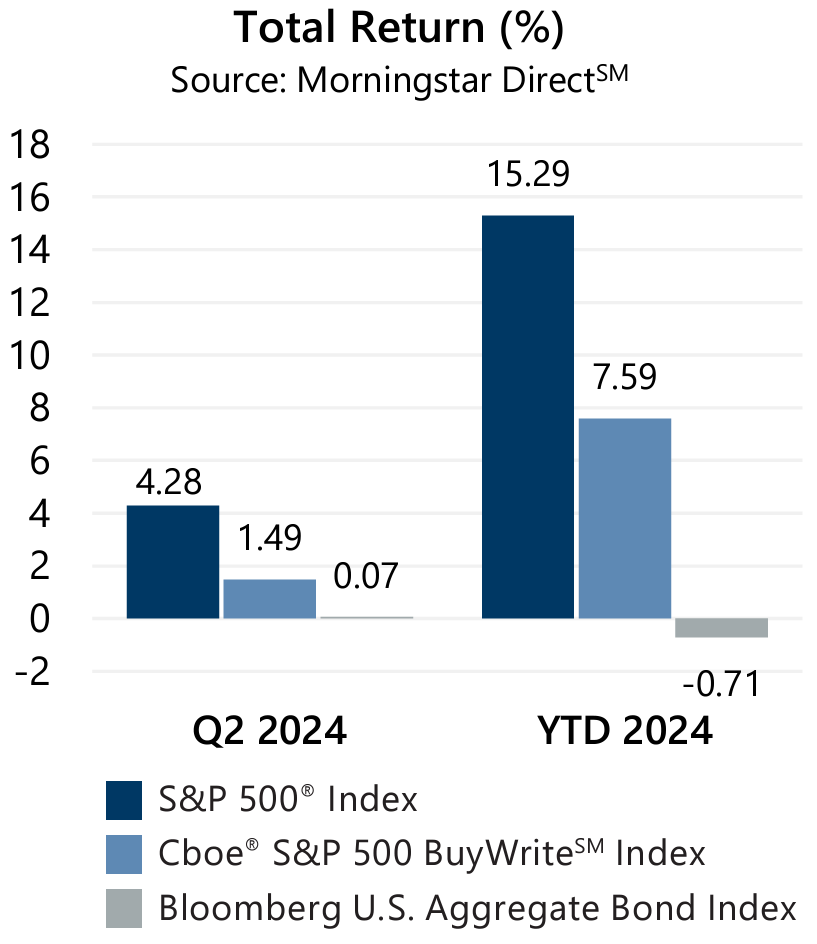
 The Cboe® S&P 500 BuyWriteSM Index1 (the BXMSM) returned 1.49% during the second quarter, with returns of -1.36%, 1.09%, and 1.77% in April, May, and June, respectively. From the start of 2024 through quarter-end, the BXMSM has returned 7.59%. The premiums the BXMSM collected as a percentage of its underlying value provided downside loss mitigation. The BXMSM collected premiums of 1.72%, 1.39%, and 1.36% in April, May, and June, respectively.
After the equity market advance in March, the BXMSM entered April with relatively low market exposure which increased until the market’s intra-quarter low on April 19, at which time the BXMSM wrote its new index call option with a May expiration and reset its market exposure. From the close of March to April 19, the BXMSM offset 289 bps of downside protection with a return of -2.51% relative to the -5.40% decline of the S&P 500® Index. From April 19 to quarter-end, the BXMSM returned 4.09%, though the passive, rules-based approach paired with premiums collected in May and June were insufficient in keeping pace with the rapid advance of the S&P 500® Index.
The Bloomberg U.S. Aggregate Bond Index (the Agg) returned 0.07% in the second quarter with monthly returns of -2.53%, 1.70%, and 0.95%, respectively. Year-to-date through June 2024, the Agg has returned -0.71%. The yield on the 10-year U.S. Treasury Note (the 10-year) ended March at 4.20% and reached an intra-quarter high of 4.70% on April 25. The 10-year drifted to an intra-quarter low of 4.22% in June and closed the quarter at 4.40%. The historical yield curve inversion continued through the second quarter, with the yield on the 2-year U.S. Treasury Note exceeding that of the 10-year since July 5, 2022.