The Cboe® Volatility Index (the VIX®) is a measure of the market forecast of the likely price movement of an asset – implied volatility. However, many investors also use it as a gauge of risk, fear or stress in the market. After spending most of the summer in the low- to mid-teen range, the VIX® reached 12.82 on September 14, a level not seen since January 2020. While still well above quantitative-easing era levels, some found surprise given the abundant potential drivers of volatility, particularly at the macroeconomic level. However, markets, expectations and moods can change rapidly. From its September 14 low through October 6, the VIX® rose nearly 40% to close October 6 at 17.45.
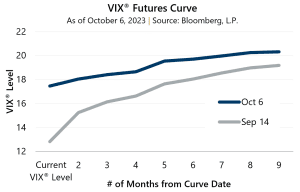 At its low on September 14, the VIX® Futures Curve was relatively steep, with the front end of the curve (most current) well below that of levels further out (longer dated). This suggested that while volatility was low today, investors anticipated levels to return to an average range in nine months. As the first week of October came to a close, the front end of the curve rose, while the back end remained in-line with long-term averages, flattening the curve, and suddenly near-term volatility was much more in line with future expectations that were now above the VIX® long-term average.
While avoiding a true inversion, investors may wonder what predictive power such a flattening has, if any. History has shown us that the VIX® futures curve, as with many other benchmarks, may at times invert for a short period of time before returning to what would be more normal upward sloping conditions. When this happens, it may not be an “all clear” signal but certainly relieves some anxiety for investors.
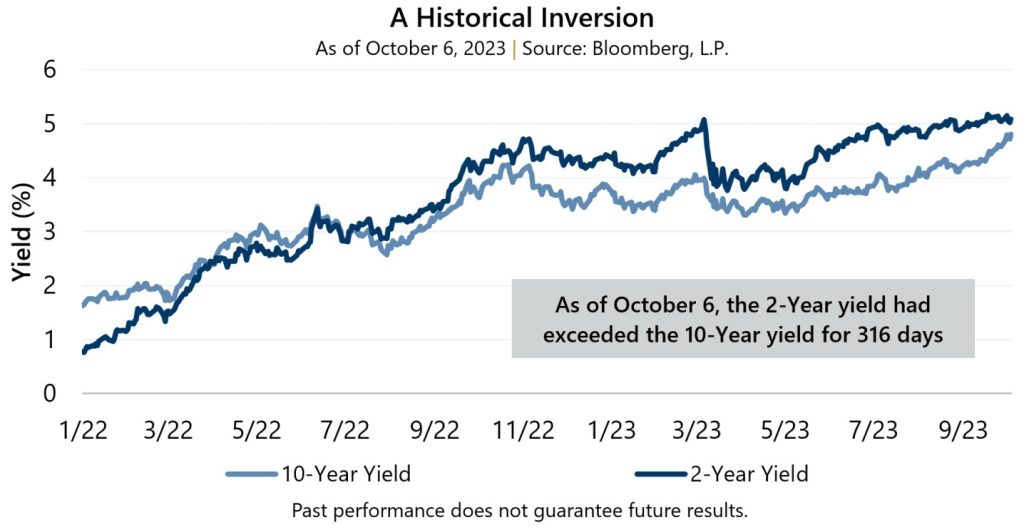
This flattening in the VIX® curve is in stark contrast with the current yield curve in the U.S. As of October 6, 2023, the yield on the 10-year U.S. Treasury Bill (the 10-year) had been below that of the 2-year U.S. Treasury Bill (the 2-year) for… 316 days. While past performance is no guarantee of future results, inversions such as these – and for as long as these – have previously telegraphed many recessions in the U.S. This current stretch is the longest inversion of the yield curve that the U.S. has seen in over 60 years. Only time will tell the story of how and when the environment may normalize but the situation certainly continues to serve as a source of uncertainty in an increasingly uncertain market.