The S&P 500® Index returned 9.22% for the month of July, bringing its year-to-date return to -12.58%. After a bruising June in which the S&P 500® Index entered a bear market, and despite the second consecutive quarter of domestic economic contraction, the equity market staged a strong rally in July. Resilient corporate earnings reports and a positive response to Federal Reserve policy and rhetoric propelled the S&P 500® Index to its eighth highest monthly return since 1988. From its year-to-date low on June 16 through July 31, the S&P 500® Index has climbed 12.81%.
U.S. macroeconomic data released in July reflected a softening economic backdrop, due to record inflation and tightening monetary policy, paired with a relatively resilient labor market. The first estimate of Gross Domestic Product for the second quarter of 2022 showed that the U.S. contracted by an annualized rate of -0.9%, worse than the consensus expectation for growth of 0.5% during the quarter. The June unemployment rate held steady from the previous month and was in line with the consensus estimate at 3.6%, while the participation rate ticked down to 62.2%. The June Consumer Price Index, released July 13, continued its record-breaking streak with a year-over-year increase of 9.1% which was above the consensus expectation. Second quarter aggregate operating earnings were on track to climb 0.43% quarter-over-quarter while increasing more than 20% year-over-year. With over 50% of companies reporting, nearly 80% met or exceeded analyst estimates.
Implied volatility, as measured by the Cboe® Volatility Index (the VIX®), averaged 25.00 in July. Consistent with its typical relationship, average implied volatility exceeded realized volatility, as measured by the standard deviation of daily returns for the S&P 500® Index, which was 19.26% for the month. The resumption of the typical relationship between implied versus realized volatility occurred after three months of realized volatility exceeding implied volatility. The VIX® closed June at 28.71, had an intra-month high of 27.54 on July 5, then drifted to close July at its intra-month low of 21.33.
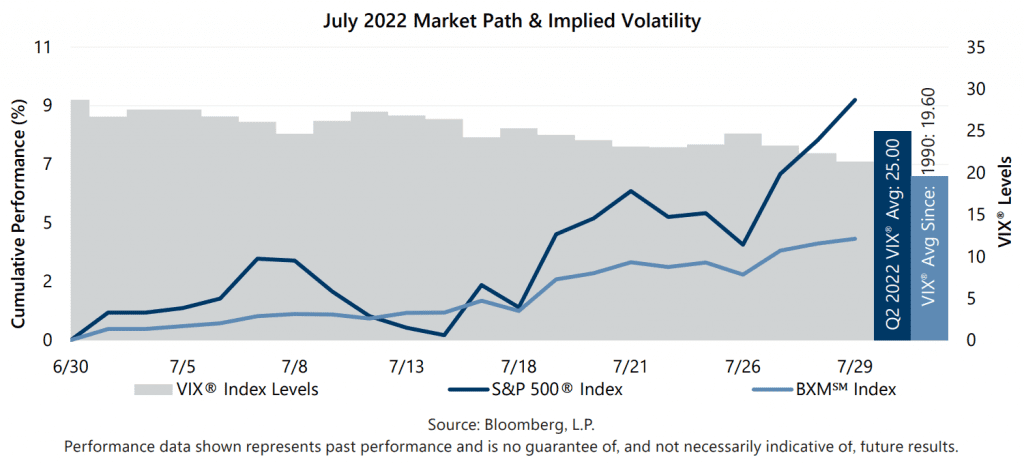
The Cboe® S&P 500 BuyWriteSM Index1 (the BXMSM) returned 3.89% in July, underperforming the S&P 500® Index by 533 basis points (bps) and bringing its year-to-date return to -6.69%. On the third Friday of each month, the BXMSM writes a new index call option as the option it wrote the previous month expires. The premiums the BXMSM collects on its written index call options have significant influence on its return potential during market advances and help to mitigate market declines. The BXMSM began the month with an in-the-money written call option due to the market advance during the second half of June. The continued market advance in the first half of July combined with the remaining time premium to earn from its expiring written index call option resulted in outperformance relative to the S&P 500® Index. From the beginning of the month through July 14, the day prior to the expiration of its written call option, the BXMSM returned 1.06%, while the S&P 500® Index returned 0.19%. On July 15, the BXMSM wrote a new index call option with an August expiration and collected a premium of 2.77%. Earning a portion of the premium it received contributed to the return of the BXMSM over the remainder of the month but was insufficient to keep pace with the rapid advance of the equity market. The BXMSM returned 2.80% from its closing value on July 14 through month-end, while the S&P 500® Index rallied 9.01% over the same period.
The Bloomberg U.S. Aggregate Bond Index returned 2.44% in July, bringing its year-to-date return to -8.16%. The yield on the 10-year U.S. Treasury Note (the 10-year) started July at 3.01%, rose to an intra-month high of 3.08% on July 8, then drifted to close the month at its intra-month low of 2.65%. Throughout a majority of July, the yield curve was inverted with the yield on the 2-year U.S. Treasury Note exceeding the yield on the 10-year.
1The BXMSM is a passive total return index designed to track the performance of a hypothetical buy-write strategy on the S&P 500® Index. The construction methodology of the index includes buying an equity portfolio replicating the holdings of the S&P 500® Index and selling a single one-month S&P 500® Index call option with a strike price approximately at-the-money each month on the Friday of the standard index-option expiration cycle and holding that position until the next expiration.
Sources: Morningstar DirectSM, Bloomberg, L.P. Performance data shown represents past performance and is no guarantee of, and not necessarily indicative of, future results.
For more information and access to additional insights from Gateway Investment Advisers, LLC, please visit www.gia.com.