December 2022 Market Recap

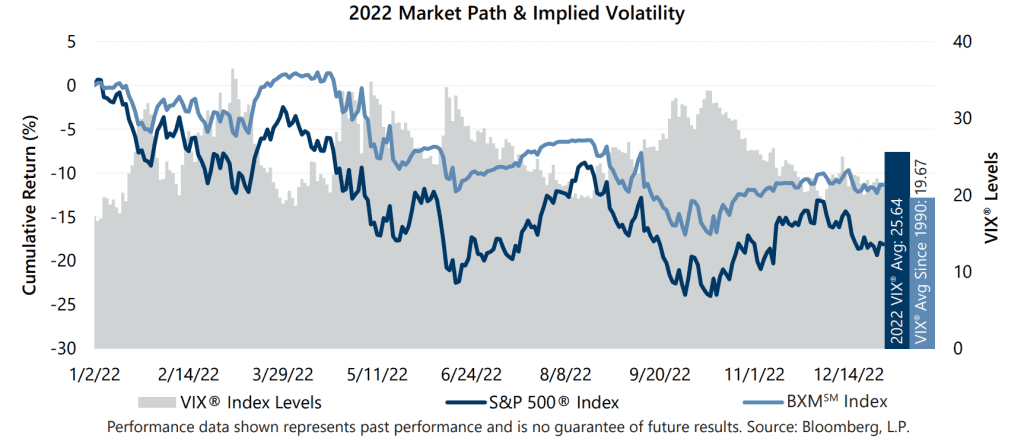
The S&P 500® Index returned 7.56% in the fourth quarter, bringing its calendar year return to -18.11%. With monthly returns of 8.10%, 5.59% and -5.76% in October, November and December, respectively, the strong rally that began the quarter was partially undone by the year’s final meeting of the Federal Reserve (the Fed). The Fed failed to deliver all the gifts on investors’ wish lists, as hopes for a full pivot in policy and rhetoric were not fulfilled. The Fed slowed its pace of tightening with a 50-basis point (bp) hike but offered no change from its relentlessly hawkish rhetoric. This spoiled the positive sentiment that fueled the market advance from the 2022 market low established on October 12. From the year-to-date low set on October 12 through quarter end, the S&P 500® Index climbed 7.76%. The equity market has declined 18.63% from its 2022 high set on January 3.

Data released in December showed an expanding U.S. economy and stable labor market despite persistently high inflation. The third estimate of Gross Domestic Product for the third quarter of 2022 showed that the U.S. grew at an annualized rate of 3.2%, outpacing the consensus expectation. The November unemployment rate held at 3.7%, in line with consensus expectation, while the participation rate ticked down to 62.1%. The November Consumer Price Index, released December 13, showed slight reprieve with a year-over-year increase of 7.1%, which was slightly lower than the consensus expectation. Third quarter aggregate operating earnings were on track to decline 0.8% quarter-over-quarter while increasing over 7% year-over-year. With more than 98% of S&P 500® Index companies reporting, nearly 75% met or exceeded analyst estimates.

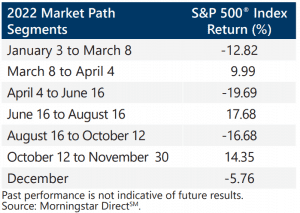
2022 ranks as the fourth worst performing year for the S&P 500® Index over the last 85 years, ranking just below the 2002 decline of -22.10%. The fourth quarter’s Fed-driven rally and selloff was emblematic of a tumultuous year driven by concerns over inflation and monetary policy. The year began with three consecutive losing quarters as the S&P 500® Index returned -4.60%, -16.10% and -4.88% in the first, second and third quarters, respectively. The quarterly returns suggest an incessant market slide followed by a fourth quarter rally. However, the equity market path was more roller coaster than avalanche, as the first three quarters featured double-digit drawdowns and the last two quarters featured double-digit rallies that resulted in only partial recoveries. Concerns over the pace and extent of monetary tightening were a key driver of each market decline while rallies were mostly ignited by investor hopes of a Fed pivot towards less hawkish, if not dovish, approach to achieving lower inflation without tipping the economy into recession.

The year also ranked as one of the most volatile on record. Realized volatility for the year, as measured by the standard deviation of daily returns for the S&P 500® Index, was 24.18%, the eighth highest reading in the past 85 years. Despite beginning the year at an intra-year closing value low of 16.60 on January 3, average implied volatility for the year, as measured by the Cboe® Volatility Index (the VIX®), was higher than realized volatility at 25.64 and ranked as the sixth highest annual average since its 1990 inception. The defining feature of implied volatility in 2022, however, was its persistently above-average readings and relatively muted responses to sharp drops in equity market value. Typically, the VIX® reaches its highest levels when the equity market is at or near its low for the year or during multi-percentage point plunges. However, its intra-year closing high of 36.45 took place on March 7, well before the equity market reached its low for the year and in advance of the steepest portion of 2022’s bear market decline. The year featured multiple multi-percentage point single day declines, including nine that exceeded 3% and two that exceeded 4%, all of which occurred after the intra-year VIX® high on March 7. This pattern of muted responses to equity market declines continued in the fourth quarter, as the VIX® had a lower average during December’s equity market selloff than its monthly averages for both October and November when the equity market was rallying. The VIX® ended the year at 21.67.

The Cboe® S&P 500 BuyWriteSM Index1 (the BXMSM) returned 6.80% in the fourth quarter of 2022, lagging the S&P 500® Index by 76 bps and bringing its full year return to -11.37%. The BXMSM underperformed the S&P 500® Index during the first two months of the quarter and provided loss mitigation during December’s equity market decline. The BXMSM returned 6.13%, 1.94% and -1.29% in October, November and December, respectively. On the third Friday of each month, the BXMSM writes a new index call option as the option it wrote the previous month expires. The premiums the BXMSM collects on its written index call options have significant influence on its return potential during equity market advances and help to mitigate market declines. The premiums the BXMSM collected as a percentage of the BXMSM’s underlying value were 3.65%, 2.42% and 2.54% in October, November and December, respectively. The BXMSM’s underperformance for the quarter was primarily due to the premium it collected in October when it wrote its call option with an expiration date of November 18 being insufficient to keep pace with the equity market’s strong advance during late October and early November. From October 21 through November 17, the BXMSM returned 2.59%, lagging the 5.33% return of the S&P 500® Index by 274 bps.

The BXMSM had strong loss mitigation in 2022, as elevated implied volatility levels contributed to above-average premiums collected by the BXMSM, which offset 674 bps of loss relative to the S&P 500® Index for the year. The BXMSM started off strong with premiums more than offsetting the equity market’s first quarter loss. While the S&P 500® Index returned -4.11% from the 2022 equity market peak on January 3 through April 4 (the closing high of the year’s first partial recovery rally), the BXMSM returned 1.10%. From April 4 through the 2022 market low on October 12, the premiums collected by the BXMSM provided additional downside protection and led to a return of -18.10% compared to the -21.26% return of the S&P 500® Index over the same period. The BXMSM had strong participation in the market’s return over the remainder of the year, despite lagging during the October-November expiration cycle. From October 12 through December 31, the BXMSM returned 6.74% while the S&P 500® Index returned 7.76%. Index call writing premiums also lowered realized volatility relative to the equity market as the BXMSM exhibited a standard deviation of daily returns of 16.12% for 2022, which was 33% lower than the S&P 500® Index.

The Bloomberg U.S. Aggregate Bond Index (the Agg) returned 1.87% for the fourth quarter of 2022, resulting in a return of -13.01% for the year. The bond market’s loss for the year was its second consecutive annual decline, and its worst since its 1976 inception. The historic loss was primarily driven by a significant climb in interest rates throughout the year, as the Fed ratcheted up efforts to combat inflation. After ending 2021 at 1.51%, the yield on the 10-year U.S. Treasury Note (the 10-year) began a climb to its intra-year peak of 4.24% on October 24, a level not seen since 2008, before drifting down to end the year at 3.87%. As rates climbed to the 10-year’s October peak, investors witnessed three of the Agg’s top five worst quarterly returns since its 1976 inception and a yield curve inversion. Returns for the first three quarters were -5.93%, -4.69% and -4.75%, respectively, before the Agg was able to recover a portion of its loss as intermediate- to long-term rates declined in the fourth quarter. As short-term rates rose over the first half of the year, the yield curve flattened. On July 5, the yield curve inverted, with the 2-year U.S. Treasury Note (the 2-year) yield exceeding that of the 10-year. The inversion remained over the rest of the year and steepened as longer-term rates came down in the fourth quarter. At 4.43%, the yield on the 2-year was 56 bps higher than the 10-year on December 31.

1The BXMSM is a passive total return index designed to track the performance of a hypothetical buy-write strategy on the S&P 500® Index. The construction methodology of the index includes buying an equity portfolio replicating the holdings of the S&P 500® Index and selling a single one-month S&P 500® Index call option with a strike price approximately at-the-money each month on the Friday of the standard index-option expiration cycle and holding that position until the next expiration.

Sources: Morningstar DirectSM, Bloomberg, L.P. Performance data shown represents past performance and is no guarantee of, and not necessarily indicative of, future results. 

For more information and access to additional insights from Gateway Investment Advisers, LLC, please visit www.gia.com.

Download: