 Markets Like Easing Money
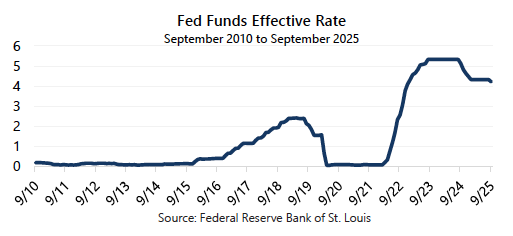
On September 17, 2025 the U.S. Federal Reserve (the Fed) lowered the Federal Funds rate by 25 basis points to 4.25%. The S&P 500® Index finished that day at 6,600.35, nearly unchanged from the prior close, and would go on to make new all-time highs in October. Meanwhile, implied volatility as measured by the Cboe® Volatility Index (the VIX®) closed September 17 at 15.72 – well below the since 1990 average of 19.46 – before climbing higher in October due in part to the ongoing U.S. government shutdown and revised trade tensions with China.
Based on rate cut history going back to 1990, this initial reaction is consistent with prior market behavior following the Fed’s first cut to interest rates in a reduction cycle – equity markets seem to immediately respond positively to the news.
- Historically, the S&P 500® Index has had an initial rally averaging 4.76% over a duration of approximately two months.
- Over a longer period, equity markets continued their rise following an initial rate cut. The average 12-month return of the S&P 500® Index after the Fed’s initial cut was 6.99%.
Hedged equity strategies participated, too, and fared well. Consider the Cboe® S&P 500 BuyWriteSM Index (BXMSM) and the Cboe® S&P 500 PutWriteSM (PUTSM), both represent passive, ruled-based approaches to option writing.
- Following an initial rate cut, the average 12-month return of the BXMSM and PUTSM was 4.78% and 8.67%, respectively.
Easing Money Isn’t Always Easy
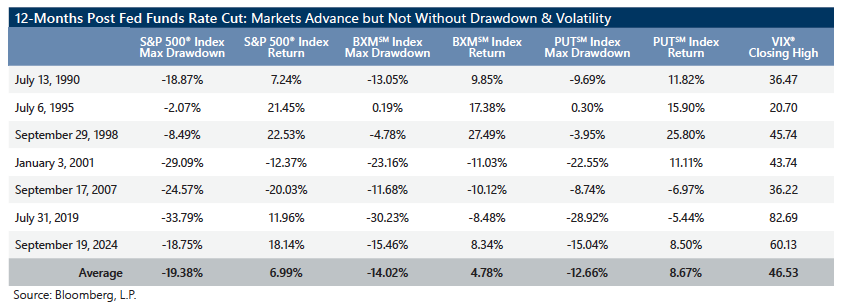
However, initial rate cuts do not necessarily create rosy market environments nor are they always the panacea of which they appear. Consider seven prior episodes of Fed rate cuts since 1990.
- In the year following the initial rate cut, the S&P 500® Index averaged a drawdown of 19.38%, with an average duration of five-and-a-half months.
- Hedged equity strategies delivered on protection during these periods, as well. The average drawdown for the BXMSM was 14.02% and the PUTSM was 12.66%.
- The average VIX® high was 46.53 during those drawdowns.