Skip to content

August 2025 Market Recap

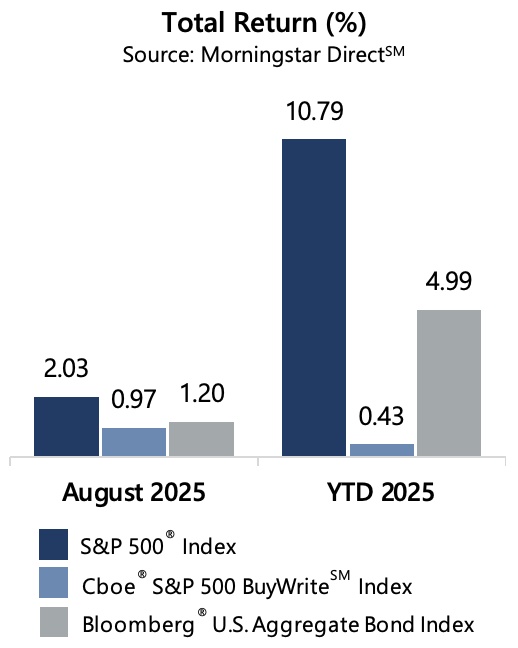
The S&P 500® Index furthered its ascent with a 2.03% return in August, bringing its year-to-date return to 10.79%. The S&P 500® Index ended the month just below a new all-time high set on August 28, 2025. The U.S. Federal Reserve opened the door to the possibility of an interest rate cut at its meeting in September, citing risks of inflation paired with a slowing labor market. Equity markets rallied on the news while interest rates dipped.   

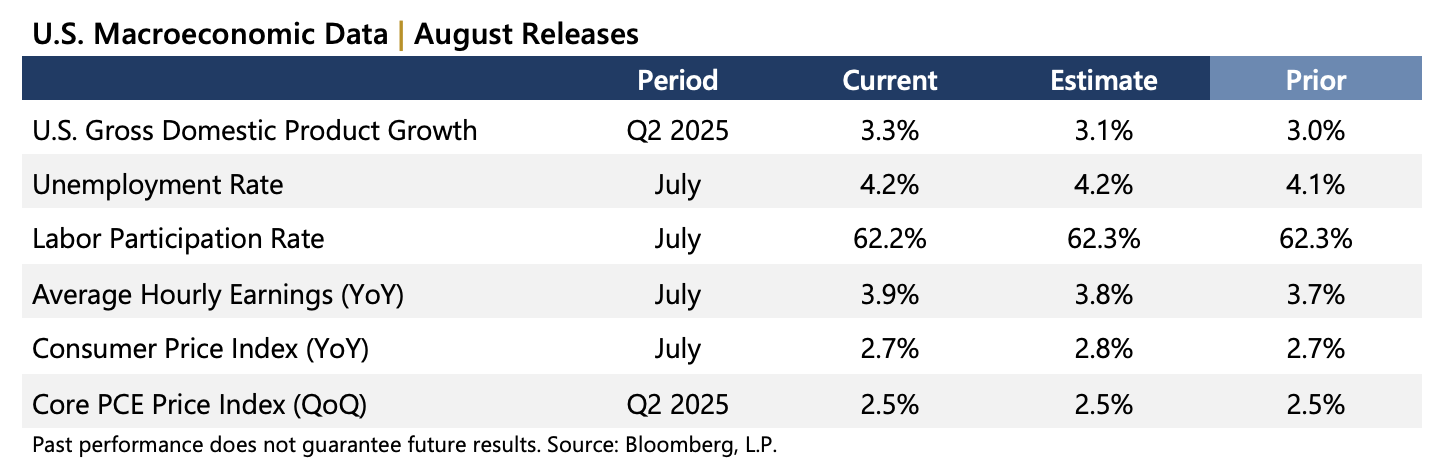
Data released in August reflected a strengthening economic backdrop with a steady labor market and inflationary environment. The current estimate of Gross Domestic Product for the second quarter of 2025 was increased from the prior estimate and better than consensus expectations. The year-over-year July Consumer Price Index, released August 12, was the same as the prior estimate and lower than the consensus estimates. The quarter-over-quarter Personal Consumption Expenditures (PCE) Price Index matched the prior month figure and estimates. With nearly 97% of S&P 500® Index companies reporting, corporate earnings are on track to be positive for the second quarter of 2025. Aggregate operating earnings increased 2.6% quarter-over-quarter and 10.6% year-over-year. More than 83% of reporting companies either met or exceeded analyst estimates.

Implied volatility, as measured by the Cboe® Volatility Index (the VIX®), averaged 15.75 in August. Consistent with its typical relationship, average implied volatility exceeded realized volatility, as measured by the standard deviation of daily returns for the S&P 500® Index, which was 11.72% for the month. The VIX® ended July at 16.72 and reached an intra-month high of 20.38 on August 1 before drifting to an intra-month low of 14.22 on August 22. The VIX® closed the month at 15.36.

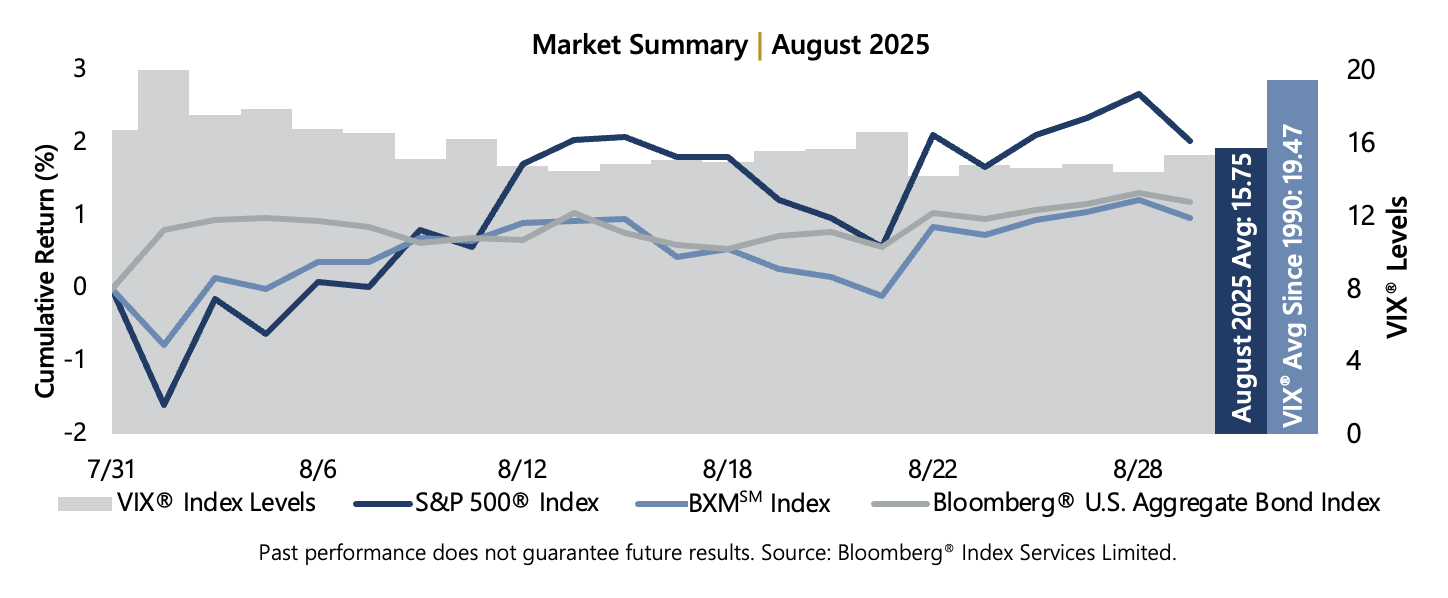
The Cboe® S&P 500 BuyWriteSM Index[1] (the BXMSM) returned 0.97% in August, bringing its year-to-date return to 0.43%. The premiums the BXMSM collected as a percentage of its underlying value provided loss mitigation and are an important component of performance. The premium the BXMSM collected as a percentage of the BXM’sSM underlying value was 1.61% in August. The rules-based timing of the BXMSM’s option writing and the level of premiums collected as a percentage of its underlying value contributed significantly to the BXMSM’s participation in periods of advance and level of loss mitigation during periods of market decline.

The Bloomberg® U.S. Aggregate Bond Index returned 1.20% in August, bringing its year-to-date return to 4.99%. The yield on the 10-year U.S. Treasury Note (the 10-year) ended July at 4.37% and reached an intra-month low of 4.19% on August 4 before climbing to an intra-month high of 4.33% on August 18. The 10-year ended the month at 4.23%.

[1] The BXMSM is a passive total return index designed to track the performance of a hypothetical buy-write strategy on the S&P 500® Index. The construction methodology of the index includes buying an equity portfolio replicating the holdings of the S&P 500® Index and selling a single one-month S&P 500® Index call option with a strike price approximately at-the-money each month on the third Friday of the standard index-option expiration cycle and holding that position until the next expiration.

Past performance does not guarantee future results. Sources: Morningstar DirectSM and Bloomberg, L.P.

BLOOMBERG® and the indices referenced herein (the “Indices”, and each such index, an “Index”) are service marks of Bloomberg Finance L.P. and its affiliates (collectively “Bloomberg”) and/or one or more third-party providers (each such provider, a “Third-Party Provider,”) and have been licensed for use for certain purposes to GATEWAY INVESTMENT ADVISERS, LLC (the “Licensee”). To the extent a Third-Party Provider contributes intellectual property in connection with the Index, such third-party products, company names and logos are trademarks or service marks, and remain the property, of such Third-Pary Provider. Bloomberg or Bloomberg’s licensors own all proprietary rights in the Bloomberg Indices. Neither Bloomberg nor Bloomberg’s licensors, including a Third-Party Provider, approves or endorses this material, or guarantees the accuracy or completeness of any information herein or makes any warranty, express or implied, as to the results to be obtained therefrom and, to the maximum extent allowed by law, neither Bloomberg nor Bloomberg’s licensors, including Third-Party Provider, shall have any liability or responsibility for injury or damages arising in connection therewith.

For more information and access to additional insights from Gateway Investment Advisers, LLC, please visit www.gia.com.

Download:

Skip to content