August 2023 Market Recap

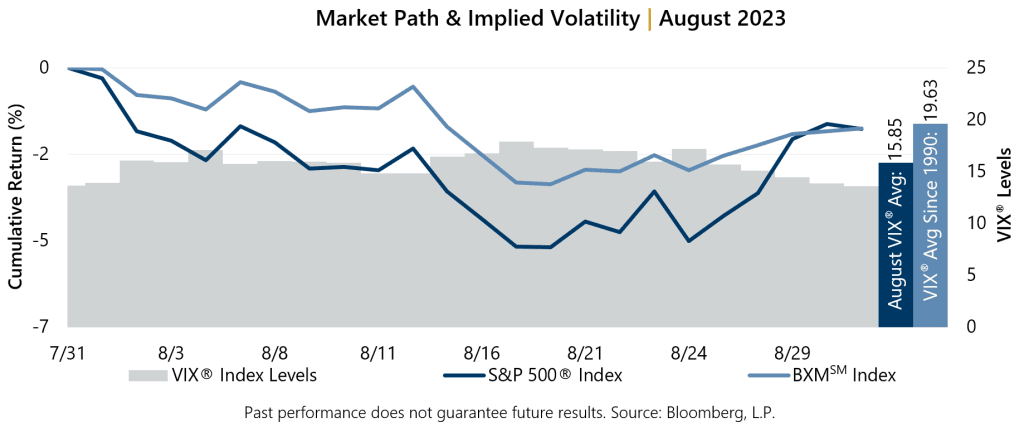
After a five-month winning streak, the S&P 500® Index declined 1.59% in August. A surprise downgrade of U.S. credit by Fitch Ratings, a credit rating agency, combined with a slew of regional bank downgrades and growing concerns around Chinese economic growth drove the selloff. From July 31 to August 18, the S&P 500® Index declined 4.66% before advancing 3.22% from August 18 through month-end. The market has had a robust 2023 with the 18.73% year-to-date return through August 31 ranking as the S&P 500® Index’s sixth best start in 35 years.

August 2023 Market Recap
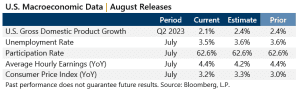
Data released in August reflected a softening, yet resilient, economy which fueled optimism of successful economic management by the U.S. Federal Reserve and a “soft-landing,” with the avoidance of recession. On the corporate front, second-quarter aggregate operating earnings were on track to increase 4.02% quarter-over-quarter and 1.56% year-over-year. With over 98% of S&P 500® Index companies reporting, more than 82% have met or exceeded analyst estimates.

Implied volatility, as measured by the Cboe® Volatility Index (the VIX®), averaged 15.85 in August. Consistent with its typical relationship, average implied volatility exceeded realized volatility, as measured by the standard deviation of daily returns for the S&P 500® Index, which was 12.29% for the month. The 3.6 percentage-point spread between realized volatility and average implied volatility was slightly below the 4.1% historical average. The VIX® ended July at 13.63, reached an intra-month high of 17.89 on August 17, then drifted to close the month at its August low of 13.57.

August 2023 Market Recap

The Cboe® S&P 500 BuyWriteSM Index1 (the BXMSM) returned -1.58% in August, bringing its year-to-date return to 10.28%. The BXMSM is an S&P 500® Index buy-write strategy which purchases (buys) an equity portfolio replicating the S&P 500® Index and sells (writes) a single one-month S&P 500® Index call option with a strike price approximately at-the-money. On the third Friday of each month, the BXMSM writes a new index call option as the option it wrote the previous month expires. This passive, rules-based approach makes the BXMSM return subject to the equity market’s path, and the premiums that the BXMSM collects on its written index call options have significant influence on its return potential. The BXMSM began the month with an in-the-money written index call option due to the market advance during July, leading to relatively low market exposure until it wrote a new index call option with a September expiration on August 18. The premium the BXMSM collected as a percentage of its underlying value was 1.91% in August. Earning a portion of the premium it received contributed to the return of the BXMSM over the remainder of the month but paired with a restrictive rules-based approach, was insufficient in keeping pace with the equity market’s rebound.

The Bloomberg U.S. Aggregate Bond Index returned -0.64% in August, bringing its year-to-date return to 1.37%. The yield on the 10-year U.S. Treasury Note (the 10-year) ended July at 3.96% before reaching an intra-month low of 4.01% on August 9. The yield on the 10-year then climbed to an intra-month high of 4.34% on August 21, before ending the month at 4.11%. Throughout August, the yield on the 2-year U.S. Treasury Note exceeded that of the 10-year, an inversion of its typical relationship that began on July 5, 2022.

1The BXMSM is a passive total return index designed to track the performance of a hypothetical buy-write strategy on the S&P 500® Index. The construction methodology of the index includes buying an equity portfolio replicating the holdings of the S&P 500® Index and selling a single one-month S&P 500® Index call option with a strike price approximately at-the-money each month on the Friday of the standard index-option expiration cycle and holding that position until the next expiration.

Sources: Morningstar DirectSM, Bloomberg, L.P. Performance data shown represents past performance and is no guarantee of, and not necessarily indicative of, future results.

For more information and access to additional insights from Gateway Investment Advisers, LLC, please visit www.gia.com.

Download: