The S&P 500® Index returned 1.56% in April, bringing its year-to-date return to 9.17 %. Investors quickly moved past threats of a banking crisis from the first quarter of 2023 and watched as regulators planned a seizure and sale of First Republic Bank starting in May. The market advance for April was supported by relatively resilient corporate earnings, a softening macroeconomic backdrop and lower levels of inflation that fueled hopes that the U.S. Federal Reserve (the Fed) would slow, or pause, its rate of monetary tightening and interest rate increases.
Results of the Fed’s efforts to tame inflation seem to have begun surfacing when looking at the macroeconomic data reported in April. The first estimate of Gross Domestic Product for the first quarter of 2023 showed that the U.S. continued to grow, albeit at a tempered rate of 1.1%, below the consensus expectation of 1.9%. The March unemployment rate of 3.5% was a decline from the prior month and better than the consensus estimate, while the participation rate ticked up to 62.6%. While remaining well above normal levels, the March Consumer Price Index, released April 12, showed a year-over-year increase of 5.0%, lower than the prior month and slightly below the consensus expectation of 5.1%. First quarter aggregate operating earnings were on track to increase 0.8% quarter-over-quarter while decreasing 5.5% year-over-year. With nearly 53% of S&P 500® Index companies reporting, more than 80% have met or exceeded analyst estimates.
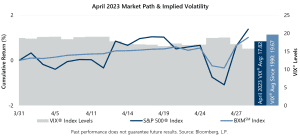 Implied volatility, as measured by the Cboe® Volatility Index (the VIX®), averaged 17.82 in April. Consistent with its typical relationship, average implied volatility exceeded realized volatility, as measured by the standard deviation of daily returns for the S&P 500® Index, which was 11.95% for the month. The 5.87 percentage-point spread between realized volatility and average implied volatility is well above the 4.1% historical average spread between the two statistics and its highest spread since July 2022. The VIX® ended March at 18.70, reached an intra-month high of 19.10 on April 11, then drifted to close the month at an April low of 15.78.
The Cboe® S&P 500 BuyWriteSM Index1 (the BXMSM) returned 1.15% in April, compared to the 1.56% return of the S&P 500® Index. The BXMSM provided 141 basis points of downside risk mitigation during the brief equity market decline from April 19 to April 26 with a return of -0.94% compared to the S&P 500® Index return of -2.35%. On the third Friday of each month, the BXMSM writes a new index call option as the option it wrote the previous month expires. The premiums the BXMSM collects on its written index call options have significant influence on its return potential during market advances and help to mitigate market declines. The BXMSM began the month with an in-the-money written index call option due to the market advance during the second half of March, leading to relatively low market exposure. Reduced market exposure paired with the remaining time premium to earn from its in-the-money index call option combined to help the BXMSM slightly outpace the S&P 500® Index from the beginning of the month through April 20, the day prior to the expiration of its written call option. The BXMSM returned 0.67% from the end of March through April 20, while the S&P 500® Index returned 0.57% over the same period. On April 21, the BXMSM wrote a new index call option with a May expiration and collected a premium of 1.85%. Earning a portion of the premium it received contributed to the return of the BXMSM over the remainder of the month. From its closing value on April 20 through month-end, the BXMSM returned 0.47% while the S&P 500® Index returned 0.98%.
The Bloomberg U.S. Aggregate Bond Index returned 0.61% in April, bringing its year-to-date return to 3.59%. The yield on the 10-year U.S. Treasury Note (the 10-year) ended March at 3.47% before dropping to its intra-month low of 3.31% on April 6. The yield on the 10-year then climbed to an intra-month high of 3.60% on April 17, before ending the month at 3.42%. Throughout April the yield on the 2-year U.S. Treasury Note exceeded that of the 10-year, an inversion of its typical relationship that began on July 5, 2022.