Key Takeaways
- Kevin Warsh succeeded Jerome Powell as Chair of the U.S. Federal Reserve (the Fed). Transitions of Fed Chair have historically contributed to S&P 500® Index drawdowns and spikes in implied volatility, as measured by the Cboe® Volatility Index (the VIX®). The severity of such drawdowns has often been tied to inflation, policy-credibility concerns, and communication clarity — and the Warsh transition has the potential to combine several of these risk factors, at once.
- Since Chair Warsh was announced to take the helm, market rate expectations have swung from pricing-in multiple interest rate cuts by year-end 2026 to pricing-in a hike.
- The same higher-inflation, higher-rate, higher-volatility regime that has unsettled past transitions has historically been a tailwind for options-based strategies, such as those offered by Gateway. During these periods, cash flow from options can benefit from both elevated volatility and higher short-term yields.
A History of Turbulent Handoffs
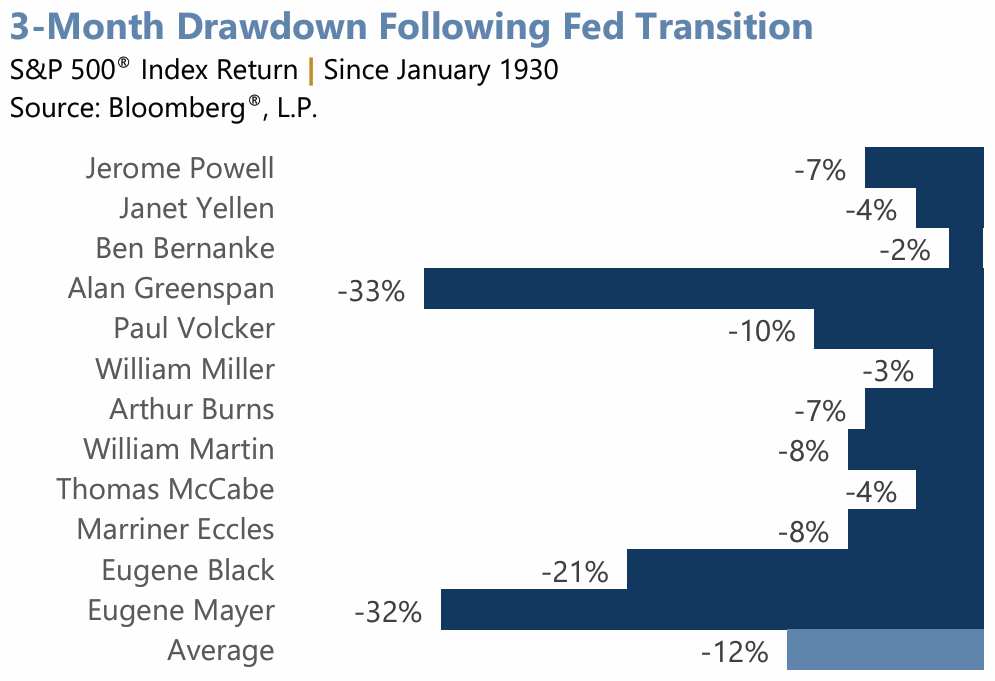
Markets rarely accept a new Fed chair calmly. Since 1930, the S&P 500® Index has logged three-month drawdowns ranging from just -2% under Ben Bernanke to -33% under Alan Greenspan.
The pattern that emerges may be less about the individual at the podium than the conditions surrounding the handoff: transitions that occur during periods of elevated inflation, fragile policy credibility, or ambiguous communication have tended to produce the sharpest drawdowns and the most persistent volatility, while calmer macro backdrops have allowed even consequential leadership changes to pass with comparatively little market disruption.
Why This Transition May Be Different
The transition to Chair Warsh, announced at the end of January 2026 and sworn in on May 22, 2026, potentially carries several risk factors historically associated with larger drawdowns and increased volatility:
Policy Uncertainty Amidst Changing Communication Style
Warsh has signaled a shakeup at the Fed, including skepticism toward forward guidance tools such as the infamous dot plot — a metric investors have referenced to estimate the direction of Fed policy.
Economic Backdrop Driving Persistent Inflation
The change in communication comes against an unfriendly macroeconomic backdrop, which has led to rates being held steady so far during 2026. The Fed recently signaled the possibility of rate hikes as it monitors the inflationary impact of the middle east conflict.
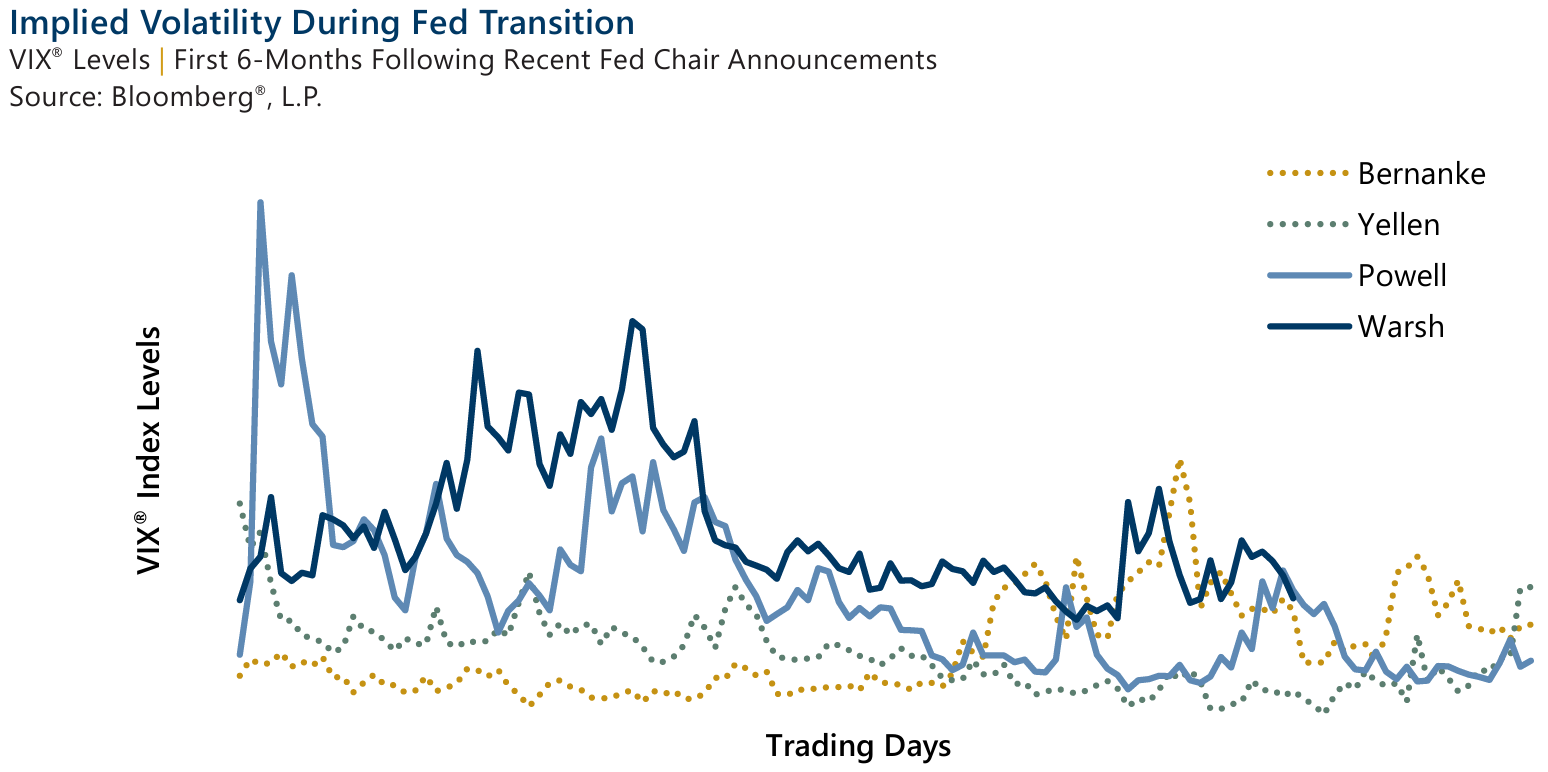
Taken together, the historical record suggests this transition combines structural communication uncertainty with genuine macro stress, resulting in a dramatic repricing of rate expectations – from roughly 100 bps of cuts priced-in by the end of February to about 25 bps of hikes priced-in by mid-June – alongside a VIX® that has popped to a high of 31.05 since Warsh’s appointment.
Volatility, as measured by the VIX®, has tended to spike in the first one to three months after the announcement of a new Fed chair, though the magnitude is also influenced by the prevailing macro backdrop at the time of transition. For example, the spike in implied volatility after Warsh was announced was heavily influenced by the impact from turmoil in Iran.
Volatility, Inflation, and the Case for Income
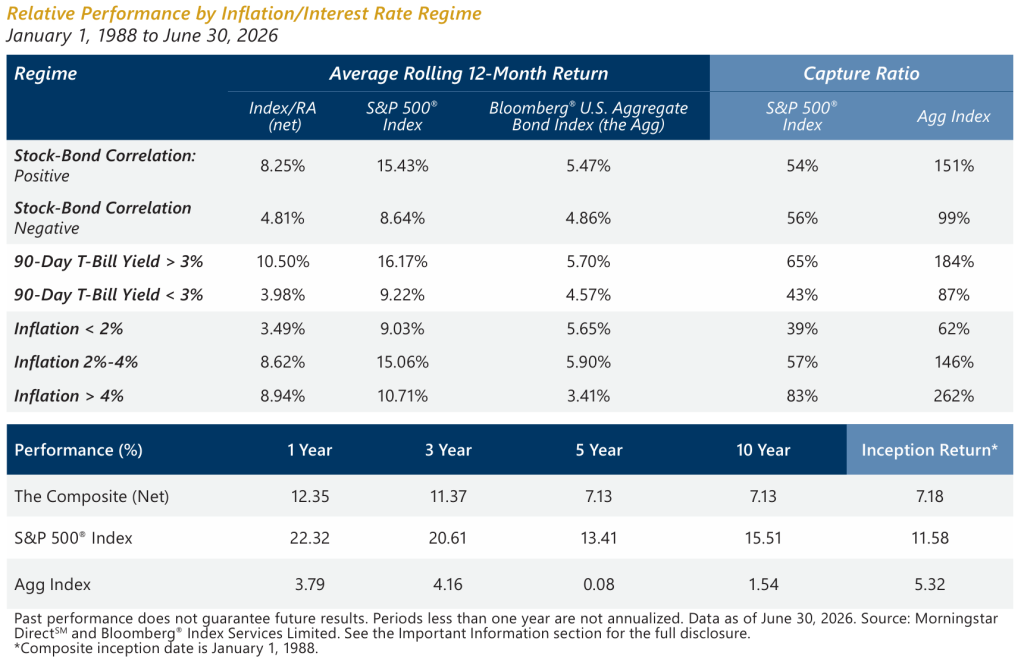
With interest rates and inflation potentially remaining elevated relative to the post-Global Financial Crisis environment, positive correlation between stocks and bonds — measured on a rolling 36-month basis — may also persist. From January 1988 to June 2026, periods of positive stock-bond correlation have coincided with average inflation of 3.19% and 90-day Treasury bill (T-bill) yields of 4.00%. This compares to average inflation of 2.26% and 90-day T-bill yields of 1.54% when the correlation has been negative. Implied volatility has told a similar story: the VIX® averaged 20.35 during positive stock-bond correlation regimes; above the 18.25 average during negative correlation regimes.
Although the past does not predict the future, the combination of higher inflation, higher rates, and higher volatility has historically been favorable for Gateway’s option-based strategies, which offer the potential to draw enhanced levels of cash flow from both option premium and short-term yield. Option strategy performance, relative to stocks and bonds, has improved alongside higher inflation and short-term rates, with return-capture ratios increasing across these higher-rate, higher-inflation regimes.
Index/RA Has Benefitted from Positive Stock-Bond Correlation
On a rolling 12-month basis, the Gateway Index/Risk-Adjusted (RA) Composite (The Composite) has returned an average of 8.25%, net of fees, when stocks and bonds were positively correlated, versus 4.81%, net of fees, when they were negatively correlated. The pattern holds when isolating rates and inflation individually: average rolling 12-month net-of-fee returns have been 10.50% when 90-day T-bill yields were above 3%, versus 3.98% when yields were below 3%. The strategy averaged an 8.62% net-of-fee return when inflation ran between 2% and 4%, and 8.94% when inflation exceeded 4%, versus just 3.49% when inflation was under 2%.
The Composite’s performance relative to stocks and bonds has improved alongside higher inflation and short-term rates, with its return-capture ratio increasing in both absolute and relative terms across these higher-rate, higher-inflation regimes.
The Bottom Line
The Warsh transition arrives with a potential combination of risk factors that were absent for many prior Fed handoffs — a structural shift away from forward guidance, an FOMC still wary of cutting into elevated inflation, and a geopolitical shock complicating the policy outlook.
History suggests this mix has the potential to keep volatility elevated in the months ahead. For risk-conscious investors looking to stay invested and sleep easy, options-based strategies – such as those offered by Gateway – may be ideally positioned to capture cash flow from both elevated implied volatility and higher short-term yields.
Rather than waiting out the uncertainty of a new Fed chair, investors may be better served by strategies built to benefit regardless of it.
Past performance does not guarantee future results. Gateway does not provide tax advice. Tax treatment and rates can and do vary over time. Investment decisions should be made based on an investor’s objectives and circumstances and in consultation with his or her investment and/or tax advisors. Data sources: Bloomberg, L.P. and Morningstar DirectSM.
The S&P 500® Index is a widely recognized measure of U.S. stock market performance. It is an unmanaged index of approximately 500 common stocks chosen for market size, liquidity and industry group representation, among other factors. You may not invest directly in an index.
The Cboe® Volatility Index (the VIX®) is a financial benchmark designed to be an up-to-the-minute market estimate of expected volatility of the S&P 500® Index and is calculated by using the midpoint of real-time S&P 500® Index (SPX) option bid/ask quotes. More specifically, the VIX® is intended to provide an instantaneous measure of how much the market thinks the S&P 500® Index will fluctuate in the 30 days from the time of each tick of the VIX®.
The Bloomberg® U.S. Aggregate Bond Index (Agg Index) is a broad-based index that covers the U.S.-dollar-denominated, investment-grade, fixed-rate, taxable bond market of SEC-registered securities. The index includes bonds from the Treasury, government-related, corporate, mortgage-backed securities, asset-backed securities, and collateralized mortgage-backed securities sectors.
Equity Market Drawdown is the negative half of the standard deviation in relation to a stock’s price. Standard deviation is a statistical measure that sheds light on historical volatility. Implied Volatility is a metric that captures the market’s view of the likelihood of changes in a given security’s price. Investors can use it to project future moves and supply and demand, and often employ it to price options contracts.
BLOOMBERG® and the indices referenced herein (the “Indices”, and each such index, an “Index”) are service marks of Bloomberg Finance L.P. and its affiliates (collectively “Bloomberg”) and/or one or more third-party providers (each such provider, a “Third-Party Provider,”) and have been licensed for use for certain purposes to GATEWAY INVESTMENT ADVISERS, LLC (the “Licensee”). To the extent a Third-Party Provider contributes intellectual property in connection with the Index, such third-party products, company names and logos are trademarks or service marks, and remain the property, of such Third-Pary Provider. Bloomberg or Bloomberg’s licensors own all proprietary rights in the Bloomberg Indices. Neither Bloomberg nor Bloomberg’s licensors, including a Third-Party Provider, approves or endorses this material, or guarantees the accuracy or completeness of any information herein or makes any warranty, express or implied, as to the results to be obtained therefrom and, to the maximum extent allowed by law, neither Bloomberg nor Bloomberg’s licensors, including Third-Party Provider, shall have any liability or responsibility for injury or damages arising in connection therewith.
Gateway Investment Advisers, LLC (Gateway) is an independent registered adviser and a successor in interest to Gateway Investment Advisers, L.P. as of February 15, 2008. Performance information for the Gateway Quality Income Composite are based on a Gateway internally-funded portfolio that has been in existence since May 1, 2023.
The “S&P 500” is a product of S&P Dow Jones Indices LLC or its affiliates (“SPDJI”), and has been licensed for use by Gateway Investment Advisers, LLC (Gateway). Standard & Poor’s® and S&P® are registered trademarks of Standard & Poor’s Financial Services LLC (“S&P”) and Dow Jones® is a registered trademark of Dow Jones Trademark Holdings LLC (“Dow Jones”). These trademarks have been licensed to SPDJI and have been sublicensed for use for certain purposes by Gateway. Gateway Quality Income is not sponsored, endorsed, sold or promoted by SPDJI, Dow Jones, S&P, their respective affiliates, and none such parties make any representation regarding the advisability of investing in such product nor do they have any liability for any errors, omissions, or interruptions of the S&P 500 Index. S&P 500® Index is a widely recognized measure of U.S. stock market performance. It is an unmanaged index of 500 common stocks chosen for market size, liquidity, and industry group representation, among other factors.