
Executive Summary
A long/short extension is straightforward to fund but more difficult to leave. Gateway tested more than one hundred deleveraging paths in simulation, across four leverage levels and more than a decade of market history, each attempting to return the portfolio to 100% long and 0% short while holding realized net capital gains to a de minimis tolerance. Every unwind begins with a seasoned loss-harvesting portfolio built over the preceding five years on a 45-day rebalance schedule.
Most of the work happens quickly. A simulated 200/100 portfolio can shed approximately 52 percentage points of short exposure in its first year and one point in its fifth, finishing five years at 18.5% short. But a portfolio that has reached that level behaves like the lightly leveraged portfolio it has become. Measuring from that point, the median path reached zero in a further 4.2 years. A large extension is a nine- to ten-year round trip rather than a faster process.
The reason the pace collapses is that a tax-neutral unwind is funded by realized losses, and a seasoned loss-harvesting portfolio has already spent them. The short sleeve supplies 74% of harvested losses early and only 14% by the end. The long book is less able to take over, because years of harvesting have sold its losers and kept its winners that continue to appreciate from favorable market conditions. Gateway’s findings are as expected, simulated portfolios starting with less leverage are easier to delever than those with more leverage; the exact transition to a long-only portfolio is unknown, leaving the investor a choice between time and cost.
Introduction
A long/short extension is straightforward to fund and more difficult to leave.
The decision to enter one is usually well considered. A client with concentrated lowbasis holdings, or simply a large taxable equity allocation, adds a short sleeve funded by leverage. That sleeve creates a steady supply of realized losses, and those losses shelter gains elsewhere in the portfolio — often on the holdings that motivated the extension in the first place.
The exit is rarely considered with the same care. Clients reasonably assume that if circumstances change — a liquidity need, a shift in risk tolerance, a new adviser, a change in the tax code — the position can be returned to a conventional long-only portfolio over some sensible period without a large tax bill. That assumption is seldom tested, because the strategy is young enough that few investors have yet needed to test it.
Gateway attempted to test this assumption with this research – testing more than one hundred deleveraging paths in simulation, across four leverage levels, using more than a decade of market history. In each case we attempted to return the portfolio to long-only (100% long and 0% short) while holding realized net capital gains to a de minimis tolerance.
Two related findings emerge.
- Pace: Deleveraging is fast at the beginning and slow at the end, far more so than a straight-line expectation would suggest. Most of the delevering is done in the first year, and the final few percentage points can take much longer while also adhering to tax- neutrality.
- Cause: A tax-neutral unwind needs realized losses to offset the gains that selling creates. Early on the short sleeve supplies them, but the short sleeve is precisely what is being dismantled, so its capacity fades as it shrinks. The long book is less able to take over, because years of successful harvesting have already sold its losers and kept its winners. Our simulated seasoned extension portfolio therefore arrived at the end of the unwind with few low-cost offsets remaining, and from that point it waits for the market to supply them rather than paying tax to force the issue.
Our Study’s Construction
Each path begins with a portfolio already at its target leverage, built over a preceding five-year period with ongoing loss harvesting, to simulate the starting point of a real account. The portfolio starts with a $1 million seed value, using the S&P 500® Index as the investable universe, becoming a seasoned portfolio after five years –carrying the lot history, the embedded gains, and the depleted loss inventory that years of harvesting produce.
We used four leverage levels — 200/100, 175/75, 145/45 and 130/30 — expressed as long exposure over short exposure. A 130/30 portfolio holds 130% of assets long and 30% short, and unwinding it means reaching 100/0. Each simulated portfolio is index-aware throughout. At every rebalance, in both the build and the unwind, the optimization process seeks the lowest tracking error to the S&P 500 Index that its constraints allow. Individual positions are held within ten percentage points of their index weights, each short position tightly capped, and no more than 450 names may be held across the long and short books combined.
The governing rule is tax neutrality. At each 45-day rebalance the portfolio reduces leverage as far as it can without realizing net capital gains beyond a de minimis tolerance. Where selling would create a gain, that gain must be offset by losses realized in the same period or drawn from losses banked in earlier periods. Where neither is available, the portfolio holds its position and tries again at the next rebalance. The constraint binds at every rebalance; no path is permitted to realize material gains in order to make progress.
Twenty-six start dates were used at each leverage level, one for every calendar quarter from the first quarter of 2015 through the second quarter of 2021 — every start date for which a full five-year unwind can be observed in our data. Each level therefore experiences twenty-six independent sequences of market history. Every path runs for five years or until it reaches 100/0, whichever comes first.
To clarify, these are simulations on a single historical sequence of returns, not records of client accounts. The period contains two significant market declines, in early 2020 and through 2022, and as the paper will show, these declines helped every path that finished its deleveraging.
Empirical Findings
Exhibit 1 shows residual short exposure after five years of continuous, disciplined unwinding.
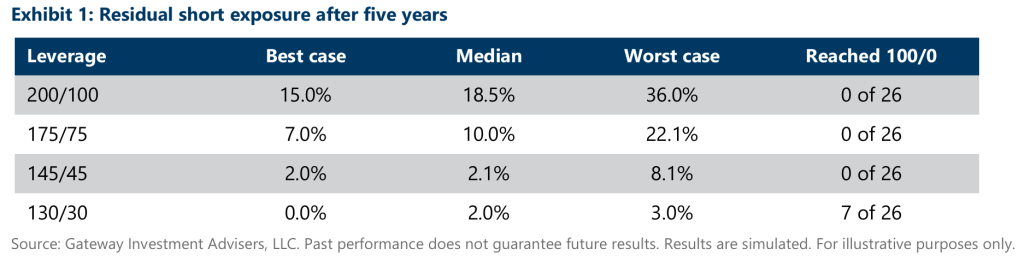
The order of residual short exposure is unsurprising, since less leverage means less to unwind. What is surprising is how little separates finishing from not finishing. A 145/45 portfolio ends the five years at much the same short exposure as a 130/30 — both close to 2%; yet only the 130/30 paths ever reached zero. Every 130/30 path ended within three points of creating a long-only portfolio; seven of the twenty-six finished the delevering process.
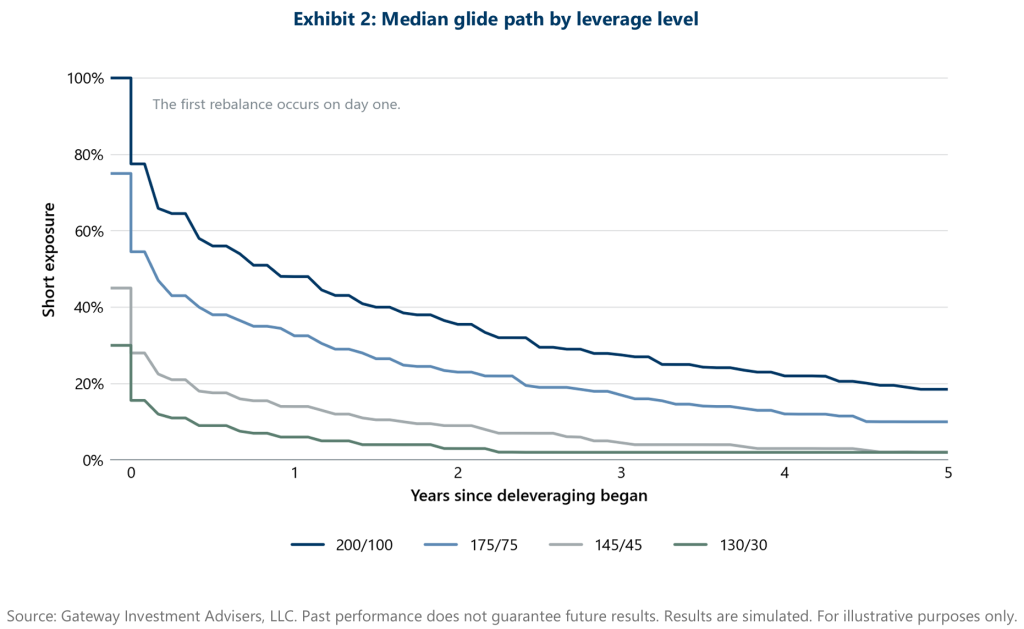
Exhibit 3 sets out the same trajectory numerically, displaying the level of short exposure remaining at each anniversary.
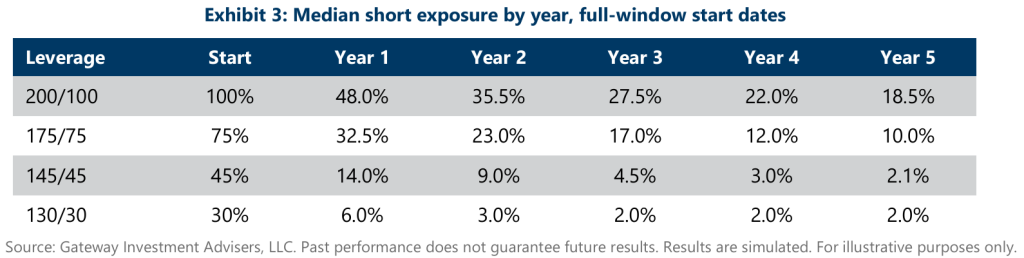
Every level of leverage does most of its work quickly.
Most of that early progress is paid for with the unrealized losses the seasoned portfolio left behind. Holding a constant leverage target for years means every harvested position was replaced as it was sold, so both the long and short side of the portfolio arrive at the unwind with a layer of recent lots still priced near cost. Because a “deleveraging trade” attempts to pair sells from long positions against covers from short positions, and only the net gain is constrained, the recent trade lots can be traded in size while realizing very little taxable gains. The short book is also at its largest here, and in a rising market some of it is always underwater, so the losses needed to offset gains on the longs are easier to find early on. The first rebalances spend those unrealized losses, and on the long side nothing replaces them, since a sale during the unwind no longer needs a fresh purchase beside it to maintain a certain level of leverage mandated by the client. What remains is the expensive part of the book: longs carrying years of gains, shorts sitting on profits. From there, every further deleveraging trade must be paid from fresh losses.
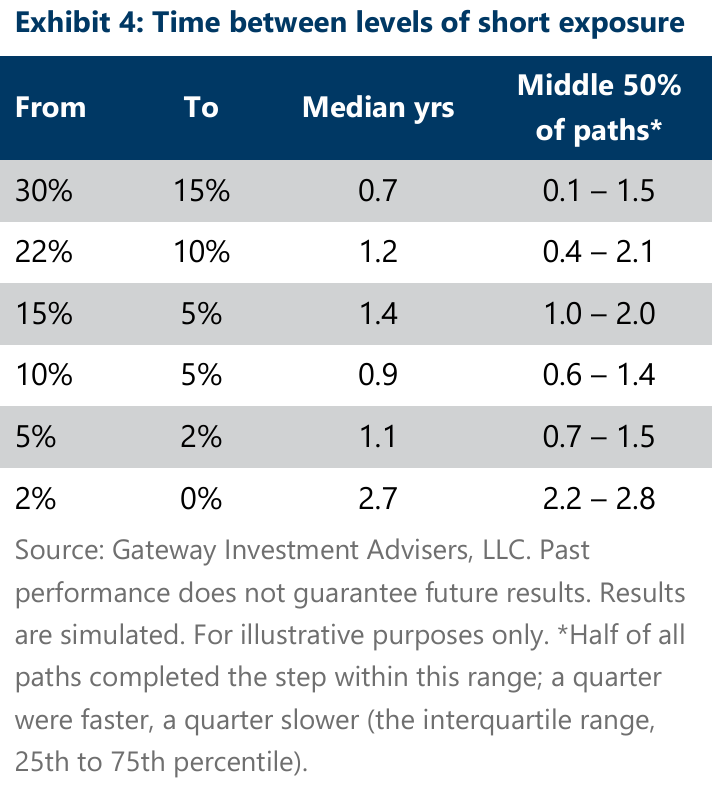 How long does it take a portfolio to move from one level of short exposure to the next, regardless of where it started? Exhibit 4 pools all 104 paths and treats exposure as the portfolio’s state rather than a label inherited from its origin.
The descent from each interval to the next is around a year until the portfolio reaches 2% short, where the portfolio is almost entirely long-only. What is slow is the last two points, from 2% short to long only.
Every completion in our sample was enabled by a market decline, so the figure is conditional on one arriving. Our window contained two, roughly one every five years, but knowing when that opportunity will arise requires perfect foresight.
Why does the pace of the unwind collapse?
The following analysis focuses on the 130/30 portfolios — the only level of leverage at which any simulated path completed the full unwind within the five-year window, and therefore the only one where the full journey can be observed. Exhibit 5 groups all 26 130/30 paths by how much short exposure remained at the time and sets the portfolio’s composition alongside the source of its harvested losses.
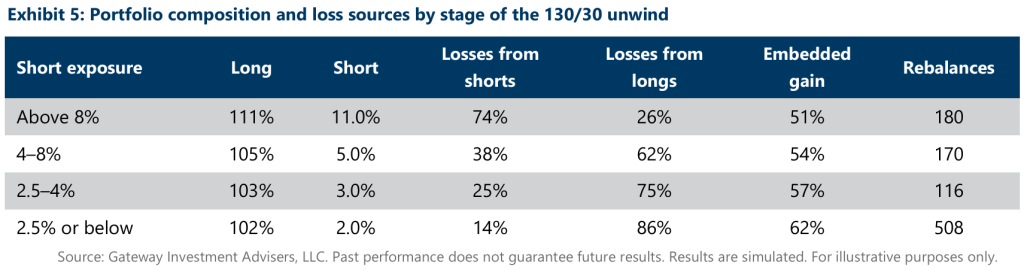
Read left to right, this is a portfolio running out of options, with three things happening at once.
The short sleeve shrinks from 11% of assets to 2%, and its contribution to harvested losses collapses from more than two-thirds to one seventh. A short position that has moved against the portfolio produces a loss when closed, and in a rising market there are many such positions — but there is progressively less of the sleeve left to draw on. As the simulated portfolio attempts to eliminate the short sleeve, the long book is left to carry the burden.
Unfortunately, over time the long book has become poorly equipped for the task, because harvesting has already stripped it of the losses it now needs to delever. Embedded gains rise from 51% to 62% of market value over the course of the unwind. This follows directly from how loss harvesting works: it sells positions that have fallen and keeps those that have risen, so running it for years systematically will naturally remove losers and retain winners. The lot selection method compounds the effect, since selling highest-cost-basis lots first is optimal for harvesting in each individual period and deliberately preserves the lowest-basis holdings. Those preserved holdings are exactly the ones that are more challenging to sell without realizing a large gain.
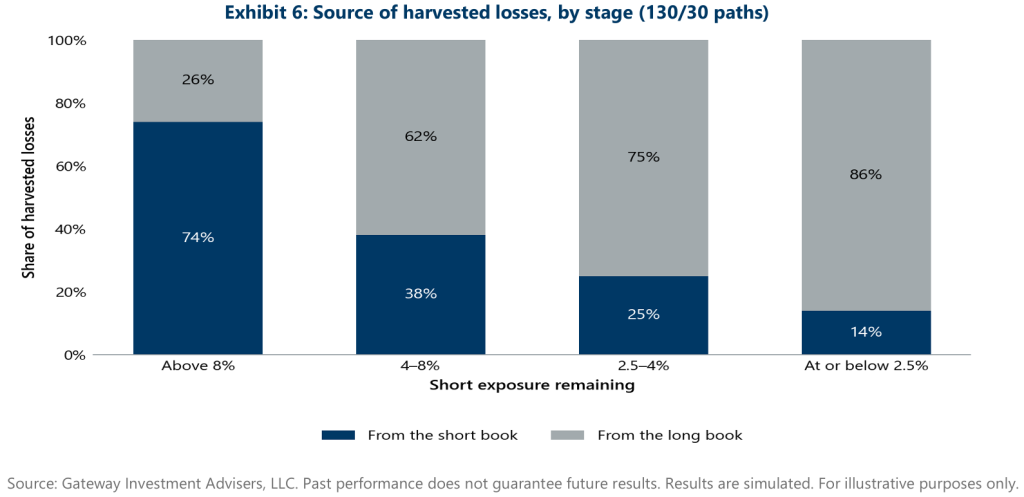
The final column of Exhibit 5 is the one to pay attention to. Of the 974 rebalances across these 130/30 portfolios, 508 were spent attempting to eliminate the last 2.5 percentage points of short exposure. That final stretch is a matter of patience. The portfolio can always execute the trade; however, to accommodate the tax constraint it must wait for the market to supply enough losses to offset the gains. A client can shorten the waiting period by absorbing the remaining gains and paying the tax, in consultation with their tax adviser — an option quantified later in this paper.
The conclusion is a genuine trade-off. The tax-loss harvesting used in the build phase is self-limiting: a loss realized then for the client’s benefit cannot be realized again later, when it’s needed during the exit phase. The value arrives up front, as each harvested loss offsets a gain the client would otherwise have paid tax on; the “cost” arrives at the end, as a slower final step to achieve long-only. This is not an argument against harvesting, which delivers real and measurable value. It is an argument for understanding what it does to a portfolio’s future flexibility, and for setting exit expectations at the strategy’s inception rather than discovering them later.
With few low-cost offsets left, what seemingly completes the unwind is a market decline. A decline is something that most long-only portfolios simply absorb, while this structure converts it into progress. A decline works through both sleeves at once: the long book develops unrealized losses that can be harvested, while the smaller short sleeve becomes profitable so that closing it realizes gains. The two arrive together and help cancel each other out. That is why deleveraging happens in bursts rather than steadily, and why the final stretch is opportunity-driven rather than calendar-driven.
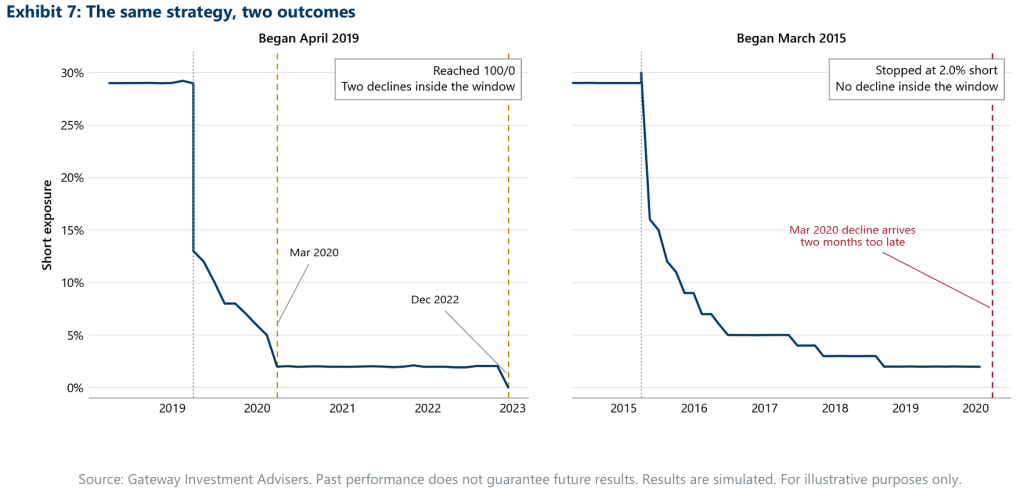
In Exhibit 7, we show two 130/30 extensions run identically, differing only from when they began. The first began its unwind in April 2019 (the gray dotted line). It reduced short exposure smoothly from 13% to 5% through 2019, funded largely by its own short sleeve. In March 2020 the portfolio fell 26% in a single period, and the unwind moved from 5% to 2% in that one rebalance, closing shorts at a gain of around $19,000 offset by long-side losses of around $28,000 created by the crash.
For the next two and a half years, through the recovery of 2020 and 2021, it sat at 2% but was not idle. Over twenty one rebalances spanning two and a half years it realized $52,400 of gains against $53,753 of losses, harvesting continuously and remaining tax-neutral throughout while adhering to the model’s objectives. It simply never assembled enough loss capacity in any single period to fund the final step.
In December 2022, after that year’s decline, a single rebalance produced enough harvestable losses to close the short side of the book completely. Two market declines did the work. The two and a half years of continuous harvesting between them barely moved the position.
The second began in March 2015 and followed the same pattern, reaching 2% short and holding there. Its five-year window closed in January 2020 with 1.98% still outstanding — two months before the decline that would almost certainly have finished it.
Nothing distinguished between these two portfolios besides the market conditions observed. The strategy, the constraints, and the discipline were identical. One met a drawdown inside its window, and one did not.
Why is it hard to achieve a fully long-only portfolio?
A tax-neutral unwind is funded by losses, and a delevered extension portfolio has spent them.
Consider what the portfolio looks like when it reaches 2% short. It is 102% long and 2% short — economically, very nearly the conventional portfolio that eh client wants. The remaining trade is small. It is this small trade the portfolio has no cheap way to fund, because at 102% it still holds 62% embedded gain and the 2% short sleeve is far too small to generate offsets to fund the unwind. The obstacle is not the size of the remaining trade, it is finding a trade that is tax-neutral.
This explains every result in the paper. It explains why year one of each simulated unwind accomplishes so much, with a large short-sleeve and a fresh loss inventory funding each other. It explains why the pace collapses, as both sources deplete together. It explains why more than half of all rebalances are spent on the last 2.5 percentage points. It also explains why every completed path in our sample finished around a market decline, a decline potentially being the only event that restores loss capacity to a portfolio that has eliminated it.
Conclusion
We believe exit expectations should be matched to the size of the position at inception. A simulated 130/30 extension is realistically easier to unwind: it reaches approximately 2% short within three years (on average) and needs only a modest decline to complete. A simulated 200/100 extension is a different commitment, since after five years of disciplined unwinding it still carries around 18.5% short, and reaching zero from there took a further 4.2 years in the paths that managed it, all of which were 130/30 extensions. That is a decade-long round trip.
The final portion of the unwind should not be presented as a standard schedule. Any projection showing steady progress to zero describes something our empirical findings do not support. Most of an unwind is a matter of time and discipline, and the last part is a matter of opportunity.
Clients retain a real choice near the end of the unwind. Every path here honored the tax-neutral constraint on its own trading, and that constraint is what deferred the final step. A client who needs a position gone by a particular date can have that. Across the 130/30 paths that were completed, the gains needing absorption on the closing rebalance were about 73 basis points of portfolio value at the median. This is approximately 29 basis points of tax at a 40% blended rate.1 Finishing early is an option rather than a penalty, and a modest one set against the years of tax-free harvesting beforehand. The unfinished paths face similar arithmetic: at the five-year mark, closing the residual outright would have cost the median 130/30 path roughly twenty basis points of portfolio value in tax, and about twice that at 145/451.
Finally, the years of loss capture that make an extension attractive are the same years that leave less capacity for the final step. Clients who value both should understand this sequence. The benefit arrives first, and the last stage of the exit is the part that waits. A client may want to alter this sequence by discussing with a tax consultant on next steps.
Further Research to Consider
Five theoretical questions arise from these results.
The first is lot selection. Every path here sold highest-cost-basis lots first, which maximizes harvested losses in each individual period and, as a direct consequence, preserves the lowest-basis holdings that later restrict the exit. Selling oldest lots first would consume that low-basis material earlier, at the cost of realizing gains sooner and surrendering harvesting alpha in the early years. Whether the trade is worthwhile is unknown and untested: the basis-erosion result suggests it might help, but the early glide is substantially funded by the loss bank that aggressive harvesting builds, and a portfolio that never accumulates that bank might stall higher than one that does. A hybrid — harvesting aggressively while the short sleeve is large, then switching once short exposure falls below roughly 4% seems to be the most promising variant, and the crossover point falls naturally out of Exhibit 5.
The second is the price of simply finishing. If the final two points are the expensive ones, it is worth quantifying what they cost to pay outright. A portfolio at 2% short with 62% embedded gain faces a specific and calculable tax bill to close immediately and comparing that bill against the expected waiting time would give clients data to start a conversation with their tax advisor.
The third is the breadth of the short universe. For simplicity, these paths could only short S&P 500 constituents, and what eventually hinders the unwind is the availability of positions carrying losses. A manager able to short more widely would have a larger pool to draw on, and whether that materially shortens the final stretch — or defers the same problem — is an important question.
The fourth is a dedicated “loss-banking” phase. The unwinds we have studied here fund each step with the losses available at that moment, banking only what each delevering step happens to leave over. An alternative solution would spend the first rebalances of the unwind harvesting losses rather than deleveraging — realizing losses while the short book, the portfolio’s loss engine, is still at full size — and building a reserve to draw on for a faster unwind afterwards. In effect, the portfolio would set its tax budget before beginning to spend it. Whether pre-funding beats a simple “pay-as-you-go” is untested in this analysis. The downside to this is that the banking phase holds leverage the client wants to be gone for longer. Wash-sale rules cap how quickly losses can be gathered, and every loss reserved for the exit is a loss the client could not use elsewhere in their portfolio.
The fifth is the step-up in basis.2 The unwinds of these portfolios stall because the long book’s embedded gains have nowhere to go, and those gains are terminated at death, when the newly inherited holdings take a cost basis equal to market value of the underlying securities. For a client with a generational horizon, a portfolio resting a few points from a complete unwind may be worth holding rather than finishing: the next generation inherits the long book at current basis and can complete the unwind, or fully liquidate, at little tax cost. The residual shorts are not stepped up, but at these exposures they are small. This is as much an estate question as an investment one and would need to be discussed with a tax advisor.
Methodology, Assumptions, and Limitations
Portfolios are constructed and rebalanced using constituents of the S&P 500® Index. The investable universe is the index constituents at each rebalance date, less cash, so additions and deletions flow through to each simulated portfolio. Each path runs on a 45-day rebalancing frequency, giving roughly eight rebalances a year and forty across a five-year window. No short-availability filter was included and a limit of 450 holdings across long and short holdings was applied. A manager able to short beyond the index would have a larger pool of harvestable losses, which would likely shorten the unwind; these results are conservative in that respect.
The unwind target is 100% long, 0% short. At each rebalance the optimizer seeks the largest reduction in short exposure achievable without net realized gains beyond a de minimis tolerance, subject to a tolerance band and a limit on how far exposure may move in a single step. Where no qualifying trade exists, the position is held, and losses realized in excess of gains accumulate in a “loss-bank” available to offset gains in later periods.
Tax lots are selected highest-cost-basis-first. Wash-sale rules are enforced over a 30-day window, and corporate actions, dividends, and integer share constraints are modelled throughout. Long and short attribution in Exhibits 5 and 6 derives from position-level closures — closing a long position is a sale, closing a short position is a purchase.
These are simulated results on one historical sequence of market returns and do not represent trading in any client account. Simulated results are prepared with the benefit of hindsight and do not reflect how live management might have responded to conditions as they developed. No representation is made that any account will achieve comparable results.
The 2015–2024 period contains two significant market declines, and those declines are what allowed any path to complete. A decade without a comparable decline may produce materially different outcomes. Every start date of the unwind included carries a full five-year unwind window. Results depend on settings as well as markets. The unwind runs on a 45-day rebalancing schedule and sells highest-cost-basis lots first; both are examined under “Further Research to Consider”. Results are drawn from 104 simulated paths: twenty-six differed start dates at each of four leverage levels. Tax neutrality is enforced on the portfolio’s own trading, subject to a de minimis tolerance per rebalance. Literal zero at each rebalance is not attainable: forced liquidation from corporate action events, dividend income, and integer-share rounding produce small gains we cannot fully suppress. The great majority of rebalances realized a net loss, and the tax arising from the portfolio’s own trading was immaterial across the five year horizon (roughly ten basis points of portfolio value in total, about two a year).
Corporate actions are outside the strategy’s control. Mergers, acquisitions, and delistings force liquidation and realize gains the constraint cannot prevent, and the resulting tax rises with leverage.
Individual path results carry variation in the results. The optimization process contains many near-identical solutions, repeating a single path can shift its terminal short exposure modestly. Medians across the paths at each leverage level are considerably steadier and are how the results are reported; individual figures, including best and worst cases, are indicative rather than exact.
Disclosures
Gateway encourages all investors to seek professional advice prior to investing. Simulations do not reflect advisory fees, transaction costs, or the market impact of trading, all of which could impact the results shown. Nothing here is tax advice. Whether a realized loss produces any benefit depends on the investor’s own circumstances, including whether they have gains available to offset and the limits applicable to capital losses. Harvesting a loss reduces cost basis, which may increase tax due on a later sale. Clients should consult their own tax adviser. Past performance does not guarantee future results. Gateway does not provide tax advice. Tax treatment and rates can and do vary over time. Investment decisions should be made based on an investor’s objectives and circumstances and in consultation with his or her investment and/or tax advisors.
Hypothetical or simulated results are included in this research note.
The S&P 500® Index is a widely recognized measure of U.S. stock market performance. It is an unmanaged index of approximately 500 common stocks chosen for market size, liquidity and industry group representation, among other factors. You may not invest directly in an index. The “S&P 500” is a product of S&P Dow Jones Indices LLC or its affiliates (“SPDJI”), and has been licensed for use by Gateway Investment Advisers, LLC (Gateway). Standard & Poor’s® and S&P® are registered trademarks of Standard & Poor’s Financial Services LLC (“S&P”) and Dow Jones® is a registered trademark of Dow Jones Trademark Holdings LLC (“Dow Jones”). These trademarks have been licensed to SPDJI and have been sublicensed for use for certain purposes by Gateway. This publication is not sponsored, endorsed, sold or promoted by SPDJI, Dow Jones, S&P, their respective affiliates, and none such parties make any representation regarding the advisability of investing in such product nor do they have any liability for any errors, omissions, or interruptions of the S&P 500 Index. S&P 500® Index is a widely recognized measure of U.S. stock market performance. It is an unmanaged index of 500 common stocks chosen for market size, liquidity, and industry group representation, among other factors.
Gateway Investment Advisers, LLC. Past performance does not guarantee future results. Source: Gateway Investment Advisers.