March 2026 Market Recap

Economic data released in March reflected a strengthening macroeconomic backdrop, steady inflation, and a shifting labor market. However, arising global conflict disrupted the outlook for inflation and U.S. monetary policy, driving the pullback in the S&P® 500 Index during the quarter. From the beginning of 2026 through January 27, the S&P 500® Index advanced 2.02% before declining 8.89% from January 27 to March 30. The S&P 500® Index bounced 2.92% on the last day of the quarter.

Implied volatility, as measured by the VIX®, averaged 20.43 in the first quarter. Consistent with its typical relationship, average implied volatility exceeded realized volatility, as measured by the standard deviation of daily returns for the S&P 500® Index, which was 14.44% for the quarter. The VIX® ended the fourth quarter at 14.95 and quickly hit an intra-quarter low of 14.49 on January 9. The VIX® climbed to an intra-quarter high of 31.05 on March 27 before ending the quarter at 25.25. The quarterly spread between S&P 500® Index implied and realized volatility, or the Volatility Risk Premium (VRP), was 6.01% – well above the since-1990 average of 3.59%.

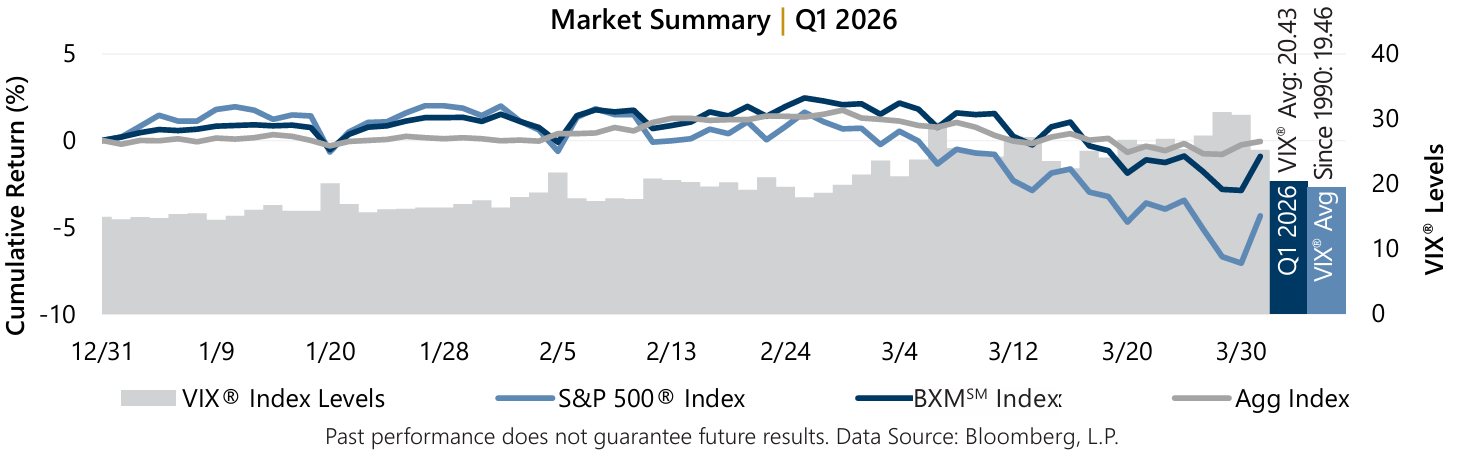
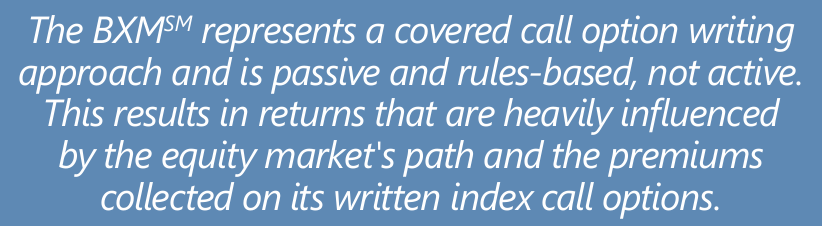
The Cboe® S&P 500 BuyWriteSM Index1 (the BXMSM) returned -0.92% in the first quarter. The premiums the BXMSM collected as a percentage of its underlying value provided loss mitigation and are an important component of performance. The premiums the BXMSM collected as a percentage of the BXMSM‘s underlying value were 1.75%, 1.66%, and 2.57% in January, February, and March, respectively. The rules-based timing of the BXMSM‘s replacement of its single written index call option contract resulted in the BXMSM having varied levels of market exposure.

The Bloomberg® U.S. Aggregate Bond Index returned -0.05% in the first quarter. The yield on the 10-year U.S. Treasury Note (the 10-year) ended December at 4.17% and hit an intra-quarter low of 3.94% on February 27 before climbing to an intra-quarter high of 4.43% on March 27. The 10-year ended the quarter at 4.32%.

[1] The BXMSM is a passive total return index designed to track the performance of a hypothetical buy-write strategy on the S&P 500® Index. The construction methodology of the index includes buying an equity portfolio replicating the holdings of the S&P 500® Index and selling a single one-month S&P 500® Index call option with a strike price approximately at-the-money each month on the third Friday of the standard index-option expiration cycle and holding that position until the next expiration.

Past performance does not guarantee future results. Sources: Morningstar DirectSM and Bloomberg, L.P.

BLOOMBERG® and the indices referenced herein (the “Indices”, and each such index, an “Index”) are service marks of Bloomberg Finance L.P. and its affiliates (collectively “Bloomberg”) and/or one or more third-party providers (each such provider, a “Third-Party Provider,”) and have been licensed for use for certain purposes to GATEWAY INVESTMENT ADVISERS, LLC (the “Licensee”). To the extent a Third-Party Provider contributes intellectual property in connection with the Index, such third-party products, company names and logos are trademarks or service marks, and remain the property, of such Third-Pary Provider. Bloomberg or Bloomberg’s licensors own all proprietary rights in the Bloomberg Indices. Neither Bloomberg nor Bloomberg’s licensors, including a Third-Party Provider, approves or endorses this material, or guarantees the accuracy or completeness of any information herein or makes any warranty, express or implied, as to the results to be obtained therefrom and, to the maximum extent allowed by law, neither Bloomberg nor Bloomberg’s licensors, including Third-Party Provider, shall have any liability or responsibility for injury or damages arising in connection therewith.

Download:

Skip to content