It’s Beginning to Look a Lot Like (an Expensive) Christmas
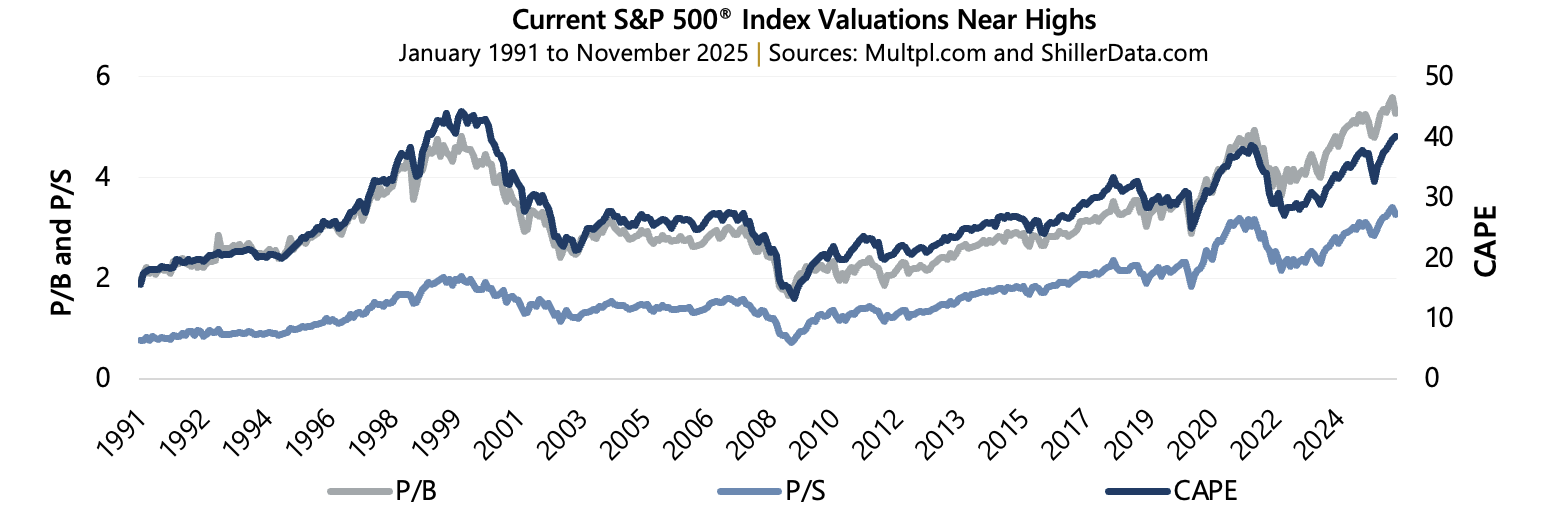
In 2025, despite simmering concerns surrounding global trade, equity markets continued to find new all-time highs, partially fueled by spending on artificial intelligence, monetary policy, and success (or lack of disaster) on trade. As prices have climbed, investors have begun taking a closer look at valuation levels1.There are various valuation measures investors may consider, such as:
-
- Price-to-Earnings (P/E), or current market price divided by latest reported earnings.
- Price-to-Book (P/B), or current market price divided by latest reported book value.
- Price-to-Sales (P/S), or current market price divided by latest reported 12-month sales.
- Others such as the Cyclically Adjusted P/E Ratio (CAPE), also referred to as the Shiller P/E Ratio after being popularized by Robert Shiller, which also uses current market price but considers average earnings over the prior decade, which are adjusted for inflation.2
White Elephant
Using Shiller data from 1881 through November 2025, with earnings through the third quarter of 2025, the current CAPE reading of 40.0 ranks in the 98.7% percentile compared to its all-time average of 17.7. Shiller’s dataset shows an average 10-year annualized return for U.S. stocks of 6.70%, but when the CAPE is above its 90th percentile, the 10-year average plunges to -0.41%. When the CAPE is above the 90th percentile for a rolling 10-year period, the average return is 4.58%.
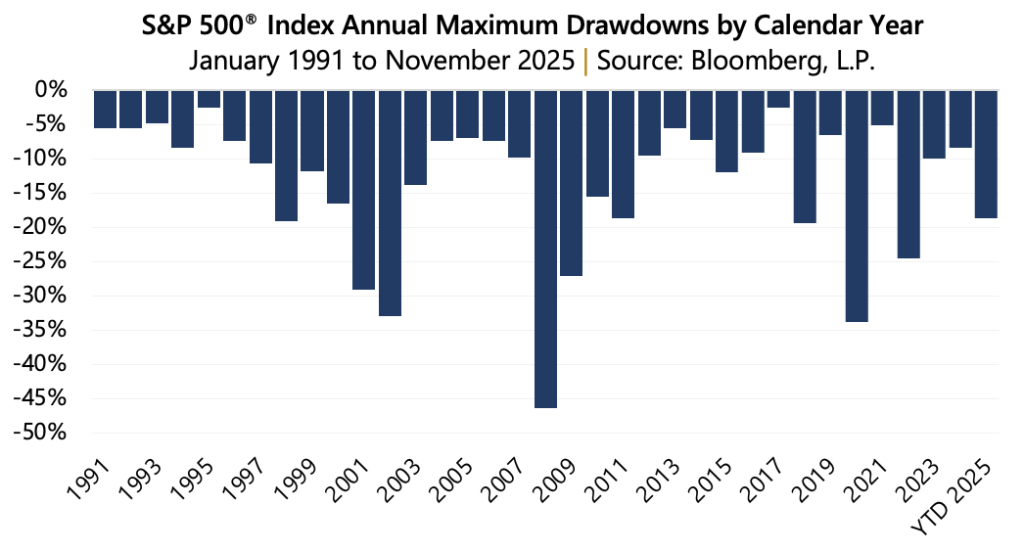
Gateway does not make market predictions but can acknowledge that stocks generally have gone up over the long-term. Also, richly valued markets can persist, and a bull market trend, like today, has potential to continue despite current valuation levels. However, revaluation (i.e. drawdowns) may occur. Since 1928, the average annual maximum drawdown for the S&P 500® Index is -15.44%. The story stays the same for more recent periods, too. Since 1991, the average annual max drawdown is -13.74%.
Christmas Favorites
Besides rich valuations, the concentration of stocks is worth considering – particularly the technology and artificial intelligence-related stocks that seem to be driving the market. Recall it was “FANG” – slang for Facebook, Amazon.com, Netflix, and Google. Then Apple was added for “FAANG”, now it’s become “MAG7” and beyond. The top names in the market-cap-weighted S&P 500® Index have grown to become sizeable contributors. From the end of 2018 through November 2025, for instance, the top 10 stocks in the S&P 500® Index returned 388.64% (25.8% annually) versus 205.2% (17.5% annually) for the entire index. Another way to see the performance impact of this concentrated group of equities is in the lagging performance of the S&P 500® Equal Weight Index (EWI)3 which has returned 139.0% (13.4% annually) during the same time period. The last time the S&P 500® EWI trailed the S&P 500® Index with such magnitude was in the late 1990s – when equity market valuations were near levels of today. From 1995 through 1999, the S&P 500® EWI returned 154.9% (20.6% annually) compared to 251.1% (28.6% annually) for the S&P 500® Index.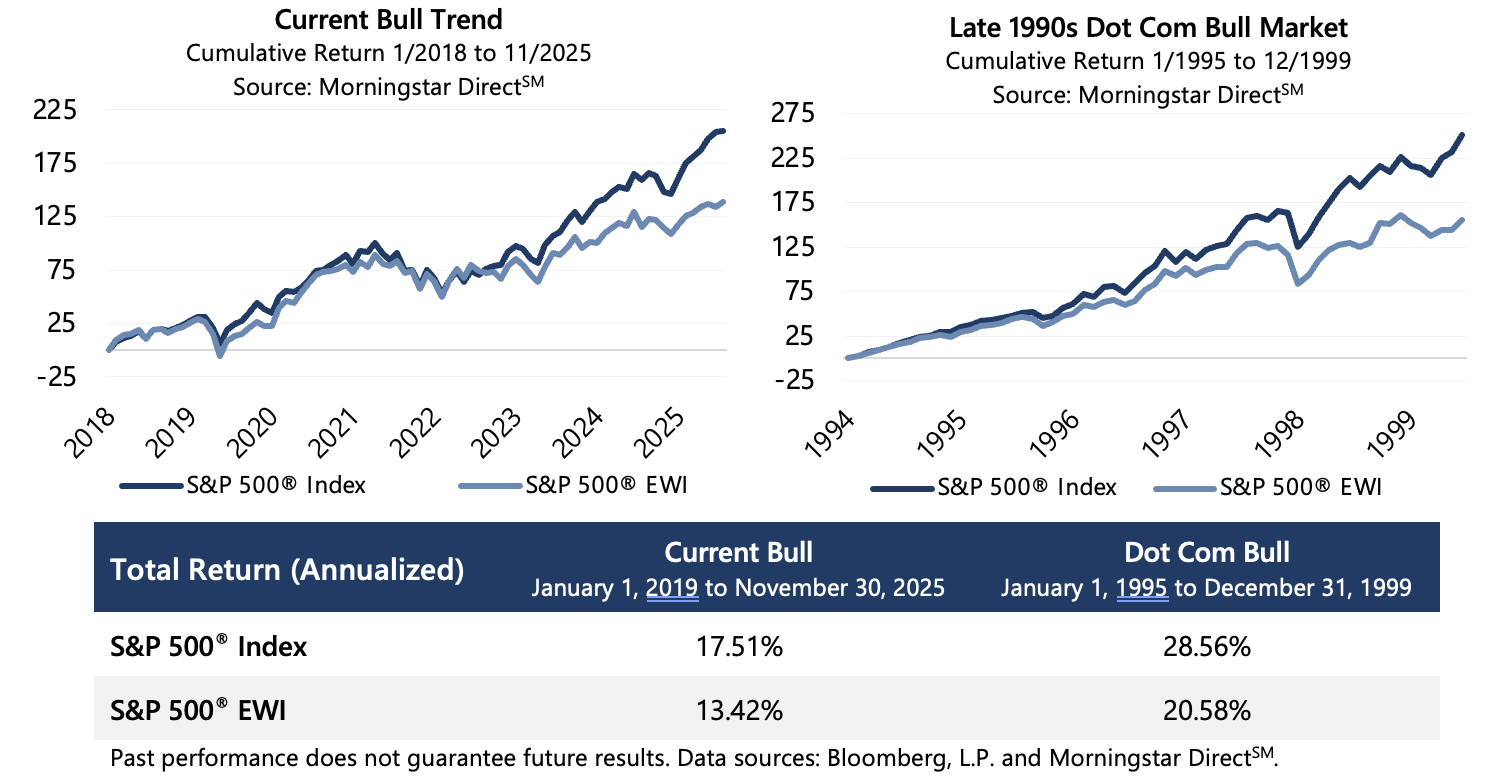
Such levels of concentration has the potential to dilute diversification benefits, possibly compounding downside risk, and/or creating large levels of unrealized gains. For instance, during the Dot Com drawdown from September 4, 2000 to October 9, 2002, the S&P 500® Index fell 47.41% while the more diversified S&P 500® EWI fell 31.7%.
Give Gateway
For those investors concerned about stretched valuations, the potential for loss, or those holding concentrated positions with high levels of unrealized gains (and potential tax liabilities), Gateway may be the answer. Founded in 1977, the firm provides extensive expertise in options-based investment solutions and experience with quantitatively driven equity strategies. The firm’s extensive experience in managing complex market exposures and seeking to optimize returns allows Gateway to deliver sophisticated, custom-tailored solutions for a wide range of risk-conscious and tax-aware investors. The firm’s strategies offer risk-conscious and tax-aware investors a single-source, unified framework for alpha and risk management.
The firm’s lineup offers potential benefits in an array of market environments, regardless of valuation levels. Gateway’s Hedged Equity strategies harness the benefits of index options, seeking to enhance risk-adjusted returns and offer downside risk protection while Single Stock Hedging & Monetization strategies aim to protect value and reduce active exposures of concentrated positions while generating income using individual options. Finally, Gateway’s Long/Short Extension strategy targets higher and more consistent tax benefits across markets with tracking error management.
Important Information
Past performance does not guarantee future results. Gateway does not provide tax advice. Tax treatment and rates can and do vary over time. Investment decisions should be made based on an investor’s objectives and circumstances and in consultation with his or her investment and/or tax advisors. Data sources: Bloomberg, L.P., Multpl.com, ShillerData.com, and Morningstar DirectSM. 1: Malkiel, Burton G. “This Famous Method of Valuing Stocks Is Pointing Toward Some Rough Years Ahead.” The Wall Street Journal, 14 Sept. 2023, https://www.wsj.com/finance/investing/this-famous-method-of-valuing-stocks-is-pointing-toward-some-rough-years-ahead-4eb6a498?mod=livecoverage_web. Accessed 1 Dec. 2025. 2: Shiller, Robert J. Shiller Data: US Stock Price, Earnings and Dividends as Well as Interest Rates and Cyclically Adjusted Price Earnings Ratio (CAPE) since 1871. ShillerData.com, https://shillerdata.com/. Accessed 1 Dec. 2025. 3: The S&P 500® Equal Weight Index (EWI) is the equal-weight version of the widely-used S&P 500® Index. The index includes the same constituents as the capitalization weighted S&P 500, but each company in the S&P 500® EWI is allocated a fixed weight – or 0.2% of the index total at each quarterly rebalance.