Skip to content

July 2025 Market Recap

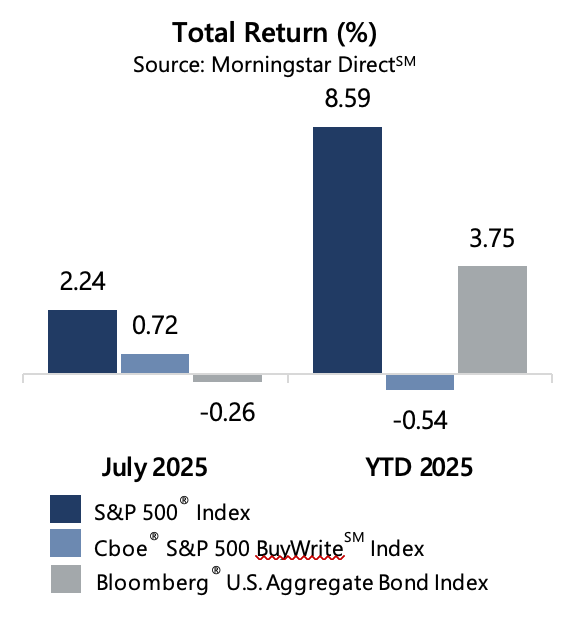
The S&P 500® Index continued its march higher with a 2.24% return in July, bringing its year-to-date return to 8.59%. The S&P 500® Index reached a new all-time high on July 28 before settling the month slightly lower. Investors remained focused on evolving trade negotiations, the health of the U.S. economy, and the direction of the U.S. Federal Reserve who decided to once again hold interest rates steady at their July 30 meeting. 

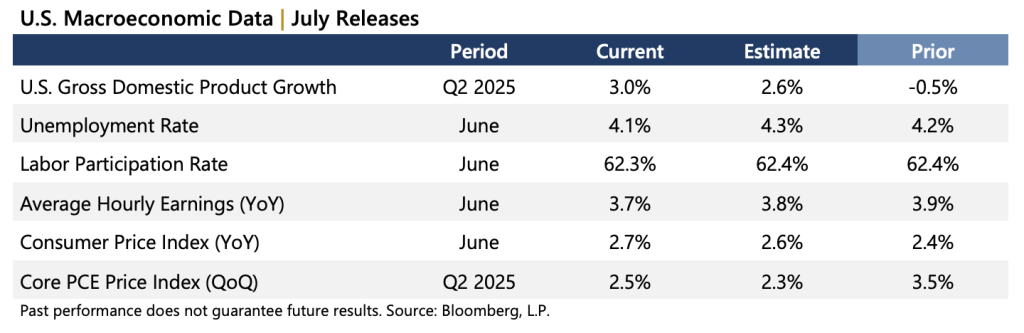
Data released in July reflected a resilient economic backdrop with a steady labor market and inflationary environment. The current estimate of Gross Domestic Product for the second quarter of 2025 was an improvement from the first quarter and better than consensus expectations. The year-over-year June Consumer Price Index, released July 15, was higher than consensus estimates and the prior period. The quarter-over-quarter Personal Consumption Expenditures (PCE) Price Index dipped below the prior month figure and was above estimates. With nearly 63% of S&P 500® Index companies reporting, corporate earnings are on track to be positive for the second quarter of 2025. Aggregate operating earnings increased 2.1% quarter-over-quarter and 10.1% year-over-year. More than 84% of reporting companies either met or exceeded analyst estimates.

Implied volatility, as measured by the Cboe® Volatility Index (the VIX®), averaged 16.38 in July. Consistent with its typical relationship, average implied volatility exceeded realized volatility, as measured by the standard deviation of daily returns for the S&P 500® Index, which was 6.49% for the month. The VIX® ended June at 16.73 before reaching an intra-month high of 17.79 on July 7. The VIX® drifted to an intra-month low of 14.93 on July 25 before ending the month at 16.72.  

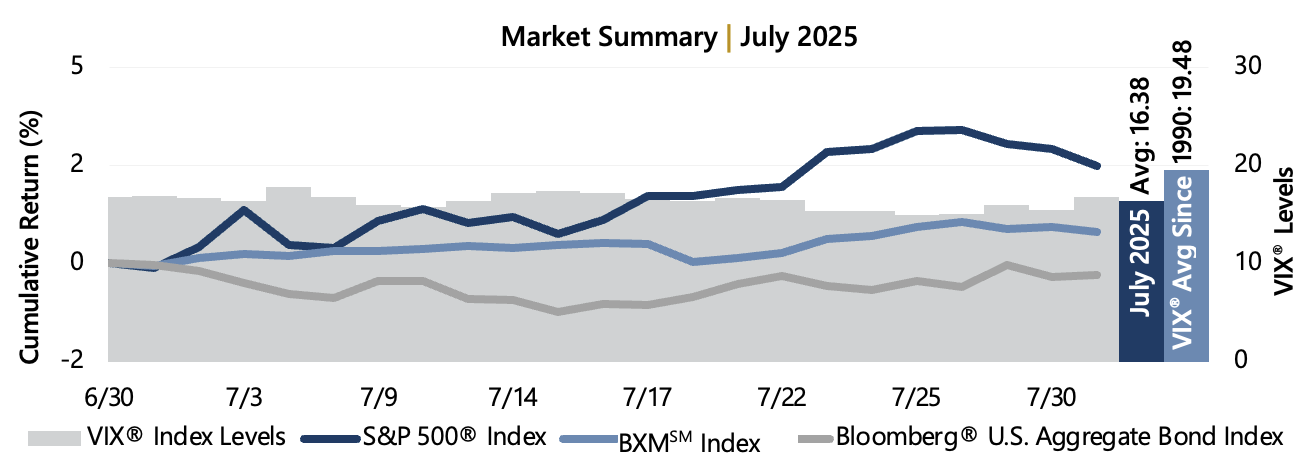
The Cboe® S&P 500 BuyWriteSM Index[1] (the BXMSM) returned 0.72% in July, bringing its year-to-date return to -0.54%. The premiums the BXMSM collected as a percentage of its underlying value provided loss mitigation and are an important component of performance. The premium the BXMSM collected as a percentage of the BXM’sSM underlying value was 1.60% in July. The rules-based timing of the BXMSM’s option writing and the level of premiums collected as a percentage of its underlying value contributed significantly to the BXMSM’s participation in periods of advance and level of loss mitigation during periods of market decline.

The Bloomberg® U.S. Aggregate Bond Index returned -0.26% in July, bringing its year-to-date return to 3.75%. The yield on the 10-year U.S. Treasury Note (the 10-year) ended June at 4.23% and reached an intra-month low of 4.24% on July 1 before touching an intra-month high of 4.48% on July 15. The 10-year ended the month at 4.37%.

[1] The BXMSM is a passive total return index designed to track the performance of a hypothetical buy-write strategy on the S&P 500® Index. The construction methodology of the index includes buying an equity portfolio replicating the holdings of the S&P 500® Index and selling a single one-month S&P 500® Index call option with a strike price approximately at-the-money each month on the third Friday of the standard index-option expiration cycle and holding that position until the next expiration.

Past performance does not guarantee future results. Sources: Morningstar DirectSM and Bloomberg, L.P.

BLOOMBERG® and the indices referenced herein (the “Indices”, and each such index, an “Index”) are service marks of Bloomberg Finance L.P. and its affiliates (collectively “Bloomberg”) and/or one or more third-party providers (each such provider, a “Third-Party Provider,”) and have been licensed for use for certain purposes to GATEWAY INVESTMENT ADVISERS, LLC (the “Licensee”). To the extent a Third-Party Provider contributes intellectual property in connection with the Index, such third-party products, company names and logos are trademarks or service marks, and remain the property, of such Third-Pary Provider. Bloomberg or Bloomberg’s licensors own all proprietary rights in the Bloomberg Indices. Neither Bloomberg nor Bloomberg’s licensors, including a Third-Party Provider, approves or endorses this material, or guarantees the accuracy or completeness of any information herein or makes any warranty, express or implied, as to the results to be obtained therefrom and, to the maximum extent allowed by law, neither Bloomberg nor Bloomberg’s licensors, including Third-Party Provider, shall have any liability or responsibility for injury or damages arising in connection therewith.

For more information and access to additional insights from Gateway Investment Advisers, LLC, please visit www.gia.com.

Download:

Skip to content