Flannel shirts. Ripped jeans. Vintage sneakers. Denim skirts. If you spend any time with teenagers, you know these fashion markers of the 1990s and 2000s have made a comeback with today’s youth. Volatility markets are also sporting the look and trends of the same era.
Since its February 2020 spike above 40 (in response to the onset of the COVID pandemic), the average daily closing value of the Cboe® Volatility Index (the VIX®) is 25.16. Furthermore, it has not dropped below 15 in the pandemic era. These data points, along with the 2022 year-to-date average of 25.13, are evidence that recent implied volatility readings bear a greater resemblance with the trends and levels of the 1990s and early-2000s than they do with the trends and levels seen in the 2010s.
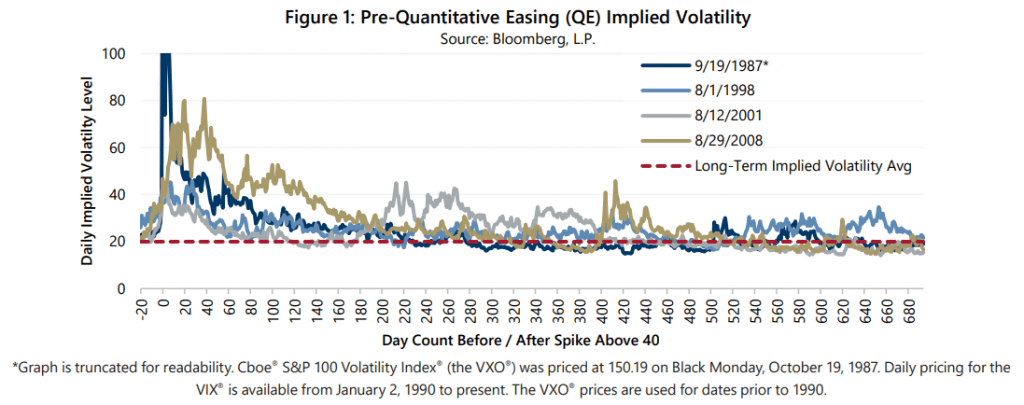
Implied volatility levels of 40 and higher are rare and are typically brought on by specific events. Figure 1 shows that four such events (Black Monday of October 1987, the collapse of hedge fund Long-Term Capital Management in 1998, the 9/11 terror attacks in 2001 and the Great Financial Crisis of 2008) not only drove implied volatility to 40 and higher, but were also followed by extended periods when implied volatility persisted at average to above-average levels.
As shown in Figure 2, the volatility spikes of the 2010s, brought on by the downgrade of U.S. government debt in 2011 and the surprise devaluation of the Chinese Yuan in 2015, were quickly followed by extended periods of persistent below-average implied volatility.
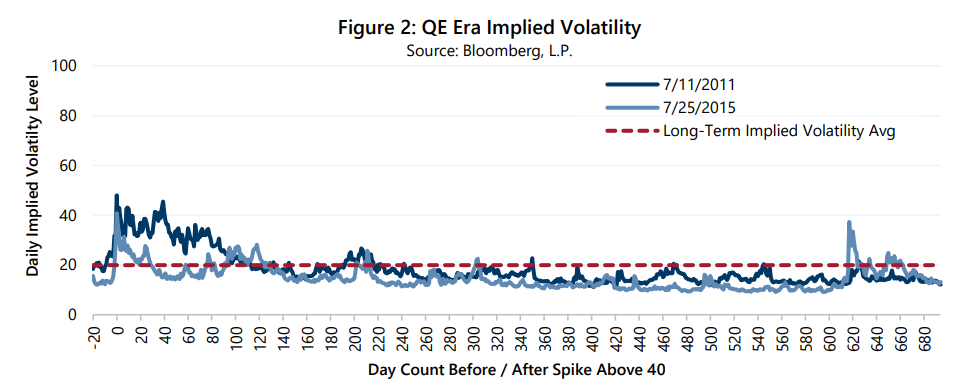
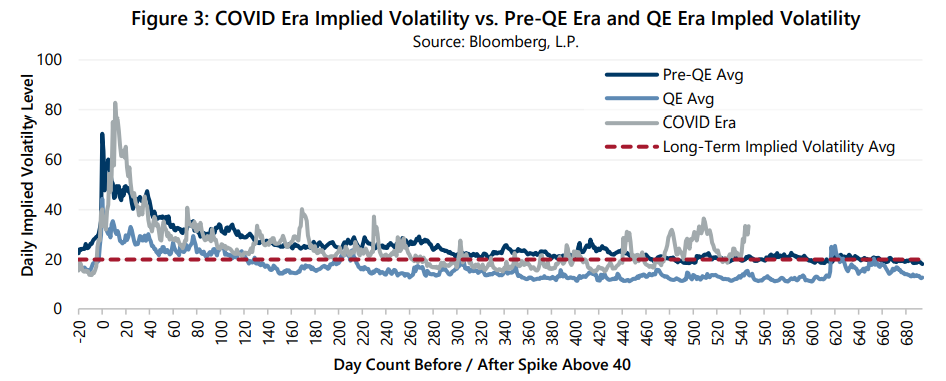
Figure 3 compares the implied volatility levels of the pandemic era to average implied volatility levels during and after the volatility spikes of the 2010s and average implied volatility levels during and after the spikes that predated the 2010s. The pandemic era is clearly distinct from the 2010s and is much more similar to the spike and post-spike levels driven by earlier events.
What caused implied volatility levels and trends to change in the pandemic era? In addition to the pandemic having much larger immediate and second-order impacts on global capital markets and economies than either the devaluation of the Chinese currency or even the downgrade of U.S. government debt, there are two other significant factors: Federal Reserve policy and the mix of participants in the markets for options and other volatility-linked derivatives.
Gateway has commented frequently on the connection between implied volatility trends and changes in Federal Reserve (the Fed) asset purchase policies. Implied volatility has generally declined or remained below its long-term average during periods of Fed balance sheet growth through the multiple quantitative easing asset purchase programs since the original “QE1” was implemented in late 2008 as a response to the Great Financial Crisis. With the Fed now fighting record inflation with higher policy rates and releasing its “Plans for Reducing the Size of the Federal Reserve’s Balance Sheet” document in January 2022, it appears the volatility-dampening quantitative easing era has come to an end.
The mix of participants in options and other volatility-linked derivatives has been the result of two phenomena. As Gateway discussed in “Will Volatility Risk Premium Remain Attractive in 2021” published in December 2020, retail investors have exhibited renewed interest in option strategies during the pandemic era and have periodically been strong buyers of call options on high volatility stocks. At the same time, several institutional-scale volatility selling strategies have exited the market due to catastrophic losses brought on by the intense volatility spike in March 2020. The net effect of these two forces has been a lessening of downward pressure on implied volatility that persisted from volatility selling strategies in the 2010s and a periodic increase in upward pressure on the price of volatility brought on by higher demand from retail investors.
Like fashion, volatility is cyclical. When and why the old trends become current again is difficult to predict, but if you wait long enough you find that the more things change, the more they stay the same. Gateway has been through multiple volatility cycles (and fashion trends) since its founding in 1977 and its approach to pursuing attractive long-term returns with less risk than the equity market is as relevant today as it was when bell-bottoms were groovy, when neon was totally awesome, when Starter® jackets were fresh and when a trucker hat was hot.
Past performance is no guarantee of future results. Source: Morningstar DirectSM.
For more information and access to additional insights from Gateway Investment Advisers, LLC, please visit www.gia.com/insights.
i: Implied volatility levels displayed are a combination of the VXO® and the VIX®. Daily pricing for the VIX® is available from January 2, 1990 to present.
ii: See: Gateway “What Will Taper Do to Implied Volatility?” Market Perspective, September 2021; Gateway Market Perspective, January 2019; Gateway Market Perspective, July 2017.