The nearly 4% pullback of the S&P 500® Index in early May was small by historical standards, but it was enough to push implied volatility to its highest levels since March 2021. The Cboe® Volatility Index (the VIX® ) established a May closing high of 27.59 and an intra-day high of 28.93 on May 12 and May 13, respectively. The average level for the VIX® in May was above its long-term average of 19.50 after dipping below that threshold in April. As of the end of May, the VIX® had been above average for 15 of the last 16 months. A closer look at volatility pricing suggests that options market participants are positioning for a potential increasing in volatility. The VIX® futures curve, the Cboe® SKEW Index (SKEW)i and the spread between implied and realized volatility all reflect strong demand for options and other volatility-linked derivatives that would potentially benefit from higher equity market volatility
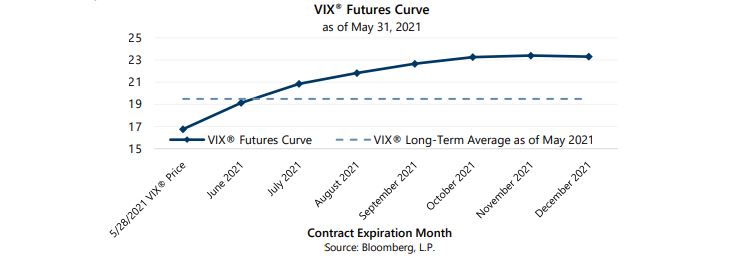
At the end of May, the VIX® futures pricing reflected expectations of rising volatility and a return to mid-20s implied volatility in the fourth quarter.
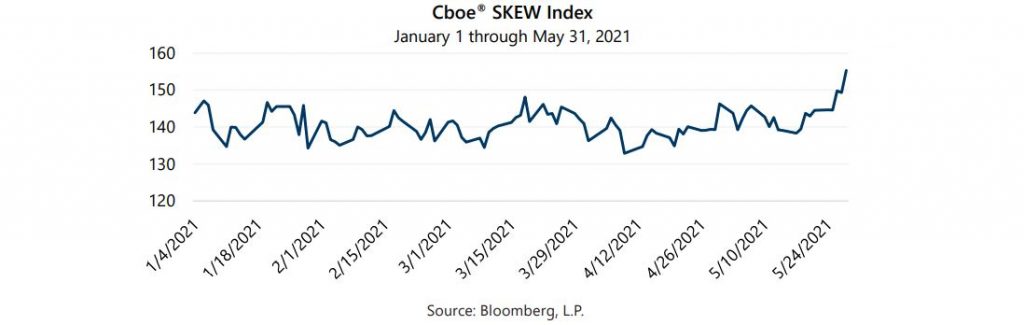
SKEW climbed sharply over the last half of May and closed the month over 155, a level not seen since Q3 2018 and less than 4 points shy of its all-time high. SKEW is calculated from the prices of a portfolio of out-of-the-money options on the S&P 500® Index. Absent all other factors, rising SKEW indicates that index option prices are reflecting option buyers’ perception of an increasing probability of a well-below-average equity market return. The long-term average of SKEW is 120 and readings at that level imply a 7.7% probability of a two-standard deviation downside event. SKEW at 155 implies a two-standard deviation downside event probability of over 17%.
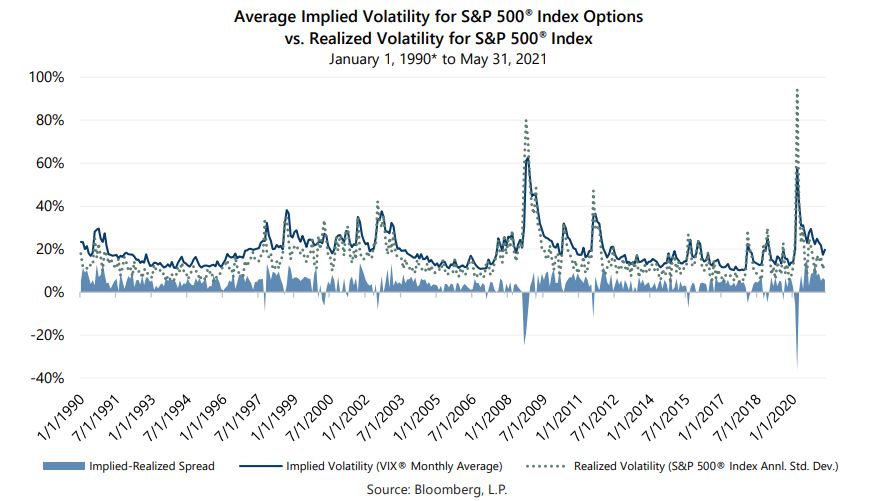
The spread between implied volatility, measured by monthly average VIX® levels, and realized volatility, measured by the S&P 500® Index’s annualized standard deviation of daily returns, shows that option buyers consistently overpay for their contracts. Recently, option buyers have been overpaying by a significant amount. In May, the spread between implied and realized volatility was 5.7 percentage points, about 40% higher than the average monthly spread of 4.1 percentage points since 1990. Moreover, May’s wider-than-average spread was at the low-end of the recent range. Specifically, over the last eight months, the monthly spread has been between 30% and 240% higher than average. While none of these measures are reliable indicators of future volatility, they show that a significant population of investors are willing to pay a premium for protection against large equity market moves.
Gateway’s investment philosophy holds that consistency is the key to long-term investment success and that generating cash flow, rather than seeking to forecast the rise and fall of the market, can be a lower risk means to participate in equity markets. As always, Gateway will look for opportunities to take advantage of the current environment while vigilantly preparing to take appropriate action should conditions change.
i SKEW is an index derived from the price of S&P 500® Index tail risk. Similar to the VIX®, the price of S&P 500® Index tail risk is calculated from the prices of S&P 500® Index out-of-the-money options. SKEW typically ranges from 100 to 150. A SKEW value of 100 means that the perceived distribution of S&P 500® Index log-returns is normal, and the probability of outlier returns is therefore negligible. As SKEW rises above 100, the left tail of the S&P 500® Index distribution acquires more weight, and the probabilities of outlier returns become more significant.