September 2023 Market Recap

The S&P 500® Index returned -3.27% in the third quarter of 2023 with monthly returns of 3.21%, -1.59% and -4.77% for July, August and September, respectively. The S&P 500® Index has climbed 13.07% since the start of 2023. An equity market rally in July, a surprise downgrade of U.S. credit by Fitch Ratings and regional bank downgrades, combined with concerns about economic growth in China, drove the S&P 500® Index to return -4.66% from the end of July through August 18. The market rebounded partially, with a 3.41% return from August 20 through September 1. However, as the yield curve continued its shift higher and interest rates maintained newfound heights, the phrase “higher for longer” increasingly settled into investor expectations – and the equity market declined -4.94% from September 1 through quarter-end. The effects of such a rapid rise of rates may take time to unfold but seem to be fostering a sense of caution and uncertainty heading into the final quarter of the year.

September 2023 Market Recap

Despite a persistent war on inflation, rising energy costs contributed to an unwelcome increase in inflation during the quarter while the labor market and macroeconomic backdrop showed signs of softening. The final estimate of Gross Domestic Product for the second quarter of 2023 showed that the U.S. continued to grow by an annualized rate of 1.70%, continuing a downward trend. The August unemployment rate of 3.8% was an increase from the prior month and worse than the consensus estimate, while the participation rate finally ticked up. The August Consumer Price Index, released September 13, showed a year-over-year increase of 3.70%, higher than expectations and the prior month. On the corporate earnings front, second quarter aggregate operating earnings were on track to climb nearly 4.0% quarter-over-quarter, just over 1.5% year-over-year. With almost 99% of S&P 500® Index companies reporting, over 82% met or exceeded analyst estimates.

Implied volatility, as measured by the Cboe® Volatility Index (the VIX®), averaged 15.01 in the third quarter. Consistent with its typical relationship, average implied volatility exceeded realized volatility, as measured by the standard deviation of daily returns for the S&P 500® Index, which was 10.81% for the quarter. The VIX® ended the second quarter at 13.59 before settling to a 2023 low of 12.82 on September 14. As the equity market softened, the VIX® climbed to an intra-quarter high of 18.94 on September 26 before closing the quarter at 17.52.

September 2023 Market Recap

September 2023 Market Recap
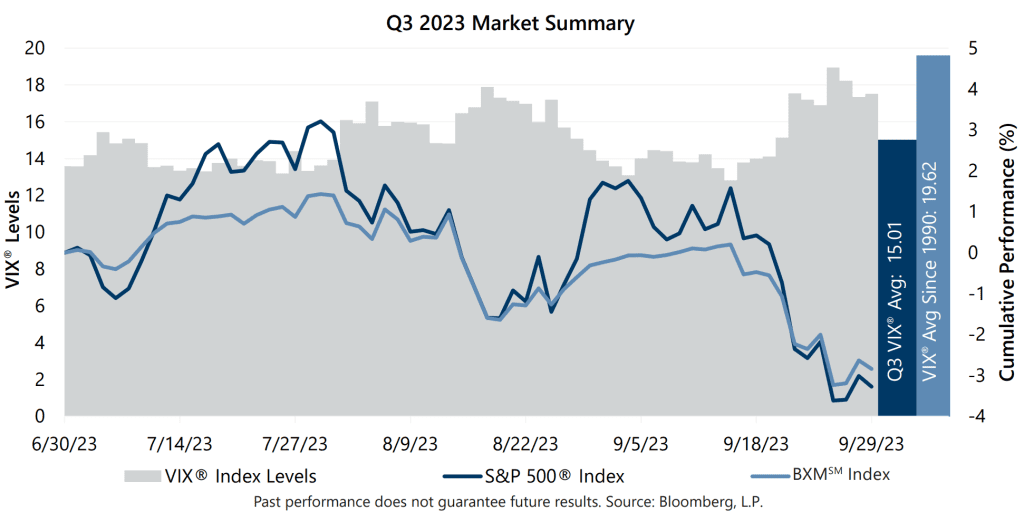
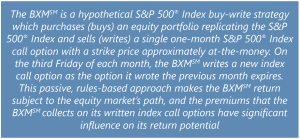
The Cboe® S&P 500 BuyWriteSM Index1 (the BXMSM) returned -2.84% in the third quarter, holding up better than the S&P 500® Index and bringing its year-to-date return to 7.33%. The BXMSM returned 1.43%, -1.58% and -2.67% in July, August and September, respectively. The premiums the BXMSM collected as a percentage of the BXM’sSM underlying value were 1.39%, 1.91% and 1.63% in July, August and September, respectively.

The equity market advance in July positioned the BXMSM to enter August with relatively low market exposure. This passive position was beneficial, providing 163 basis points (bps) of protection, during the equity market decline from the end of July through August 18. The BXMSM wrote a new index call option in August, resetting its market exposure, but this wasn’t enough to keep pace with the equity market’s late-month rally. Remaining premium from August’s written index call option combined with premium collected in September helped provide 217 bps of downside protection during September’s market decline.

The Bloomberg U.S. Aggregate Bond Index (the Agg) returned -3.23% in the third quarter as interest rates continued their ascent. The Agg has had a rough go in 2023, concluding a five-month losing streak in September with a year-to-date return of -1.21%. The yield on the 10-year U.S. Treasury Note (the 10-year) ended the second quarter at 3.84% before reaching an intra-quarter low of 3.75% in July. The 10-year yield then rose to reach an intra-quarter high of 4.61% on September 27 before closing September at 4.57%. The yield on the 2-year U.S. Treasury Note exceeded that of the 10-year for the entire quarter, an inversion of its typical relationship that has persisted since July 5, 2022.

1The BXMSM is a passive total return index designed to track the performance of a hypothetical buy-write strategy on the S&P 500® Index. The construction methodology of the index includes buying an equity portfolio replicating the holdings of the S&P 500® Index and selling a single one-month S&P 500® Index call option with a strike price approximately at-the-money each month on the Friday of the standard index-option expiration cycle and holding that position until the next expiration.

Sources: Morningstar DirectSM, Bloomberg, L.P. Performance data shown represents past performance and is no guarantee of, and not necessarily indicative of, future results.

For more information and access to additional insights from Gateway Investment Advisers, LLC, please visit www.gia.com.

Download: