The S&P 500® Index returned -4.88% in the third quarter, bringing its year-to-date return to -23.87%. The market’s path during the quarter was even more wild than the quarterly loss suggests and kept investors glued to their seats, delivering monthly returns of 9.22%, -4.08% and -9.21% for July, August and September, respectively. After officially entering bear market territory in the second quarter of 2022, resilient labor markets and corporate earnings reports paired with hope that decelerating inflation could create an opening for a “dovish pivot” by the Federal Reserve (the Fed) led the S&P 500® Index to climb 13.94% from June 30 to August 16. Unrelenting inflation and an unwavering hawkishness from the Fed soured investor sentiment however, and the S&P 500® Index fell 16.52% from August 16 through quarter-end. The drawdown over the second half of the quarter included multiple daily moves of greater than 2%, including a 3.4% drop on August 26 and a decline of more than 4.3% on September 13. The S&P 500® Index marked a new year-to-date low and maximum drawdown on September 30, 24.35% below its peak on January 3.
Macroeconomic data released in September suggested signs of a softening U.S. labor market amid aggressive monetary policy tightening and economic deceleration. The third estimate of Gross Domestic Product for the second quarter of 2022 showed that the U.S. contracted by an annualized rate of -0.6%, in line with the consensus expectation. The August unemployment rate climbed to 3.7% and was worse than the consensus estimate, while the participation rate ticked up to 62.4%. The August Consumer Price Index, released September 13, remained near record highs with a year-over-year increase of 8.3%, which was above the consensus expectation. Second quarter aggregate operating earnings were on track to decline more than 2% quarter-over-quarter while increasing nearly 17% year-over-year. With more than 98% of companies reporting, almost 80% met or exceeded analyst estimates.
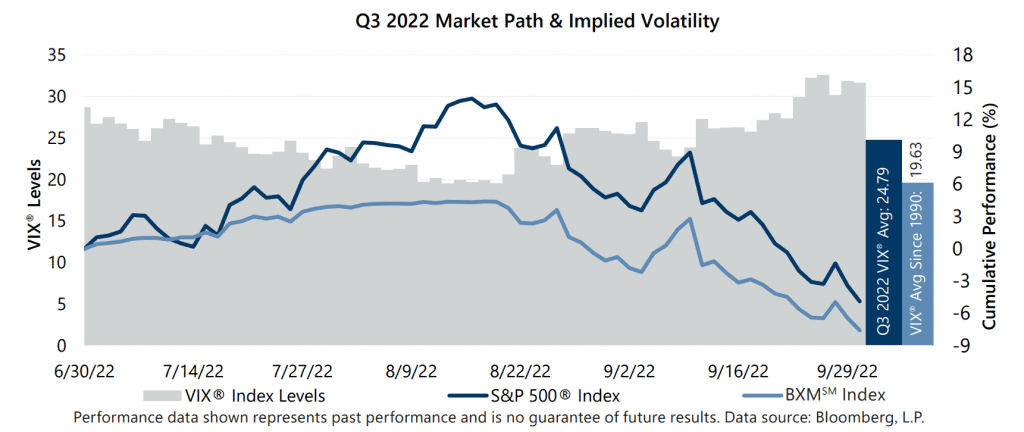
Consistent with its pattern in the first half of the year, third quarter implied volatility was consistently average to well-above average while remaining resistant to spikes during periods of steep market decline. The Cboe® Volatility Index (the VIX®) averaged 24.79 in the third quarter of 2022. Average implied volatility exceeded realized volatility, as measured by the standard deviation of daily returns for the S&P 500® Index, which was 21.39% for the quarter. The VIX® closed June at 28.71 and drifted to an intra-quarter low of 19.53 on August 12 before trending up over the remainder of the quarter. The VIX® did not breach 30 until late in the third quarter, despite the equity market drop of more than 4% on September 13 – the one-day plunge saw the VIX® close at just 27.27. The VIX® reached its intra-quarter high of 32.60 on September 27 and closed the quarter at 31.62.
The Cboe® S&P 500 BuyWriteSM Index1 (the BXMSM) returned -7.59% in third quarter, underperforming the S&P 500® Index by 271 basis points (bps) and bringing its year-to-date return to -17.01%. With monthly returns of 3.89%, -4.80% and -6.57% in July, August and September, respectively, the BXMSM’s loss mitigation relative to the S&P 500® Index in September did not make up for its lagging performance in July. On the third Friday of each month, the BXMSM writes a new index call option as the option it wrote the previous month expires. The premiums the BXMSM collects on its written index call options have significant influence on its return potential during market advances and help to mitigate market declines. The premiums the BXMSM collected as a percentage of its underlying value were 2.77%, 2.02% and 3.08% in July, August and September, respectively. From the beginning of the quarter through August 16, the BXMSM returned 4.32%, lagging the S&P 500® Index by 962 bps, as premiums collected by the BXMSM were insufficient to keep pace with the equity market’s strong advance. During the equity market decline during the second half of the quarter, the remaining premium collected on its call option written in August combined with the premium received on September 16 helped provide 510 bps of downside protection. From August 16 through quarter-end, the BXMSM declined 11.42% compared to the 16.52% decline of the S&P 500® Index.
The Bloomberg U.S. Aggregate Bond Index (the Agg) returned -4.75% in the third quarter, bringing its year-to-date return to -14.61%. The third quarter return was the Agg’s fourth worst quarterly return since 1976 and it follows first and second quarter returns that rank third- and fifth-worst, respectively. The yield on the 10-year U.S. Treasury Note (the 10-year) ended June at 3.01%, touched its intra-quarter low of 2.57% on August 1 then climbed to an intra-quarter high of 3.95% on September 27 before closing the quarter at 3.83%. Throughout all but two days in the third quarter of 2022, the yield curve was inverted with the yield on the 2-year U.S. Treasury Note significantly exceeding the yield on the 10-year.
1The BXMSM is a passive total return index designed to track the performance of a hypothetical buy-write strategy on the S&P 500® Index. The construction methodology of the index includes buying an equity portfolio replicating the holdings of the S&P 500® Index and selling a single one-month S&P 500® Index call option with a strike price approximately at-the-money each month on the Friday of the standard index-option expiration cycle and holding that position until the next expiration.
Sources: Morningstar DirectSM, Bloomberg, L.P. Performance data shown represents past performance and is no guarantee of, and not necessarily indicative of, future results.
For more information and access to additional insights from Gateway Investment Advisers, LLC, please visit www.gia.com.