Quality Revisited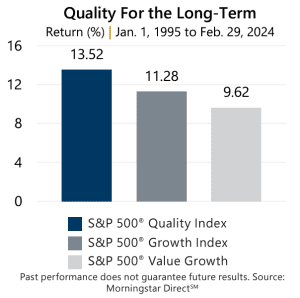 In a world full of uncertainty, the familiarity and durability offered by the quality factor is increasingly important for investors. While past results are no prediction of future outcomes, November 2023’s examination of the S&P 500® Quality Index versus the S&P 500® Value Index and the S&P 500® Growth Index determined that:
- Emphasizing quality within an equity portfolio may help investors harness the benefits of healthy firms exhibiting high-profitability, fortress balance sheets, and strong fundamentals.
- Looking back to January 1995, the S&P 500® Quality Index outperformed the S&P 500® Value Index and the S&P 500® Growth Index with lower overall risk.
The factor debate continues, however, and offers the opportunity to further investigate the quality factor – represented by the S&P 500® Quality Index. The S&P 500® Quality Index is designed to track high quality stocks in the S&P 500® Index, selected based on quality score. The quality score for individual stocks is calculated using return on equity, accruals ratio, and financial leverage ratio.
Factoring In the Rest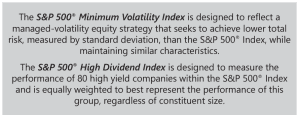 Beyond value and growth, minimum volatility and high dividend are factor-based approaches popular with investors. Minimum volatility can be represented by the S&P 500® Minimum Volatility Index, whereas high dividend can be represented by the S&P 500® High Dividend Index.
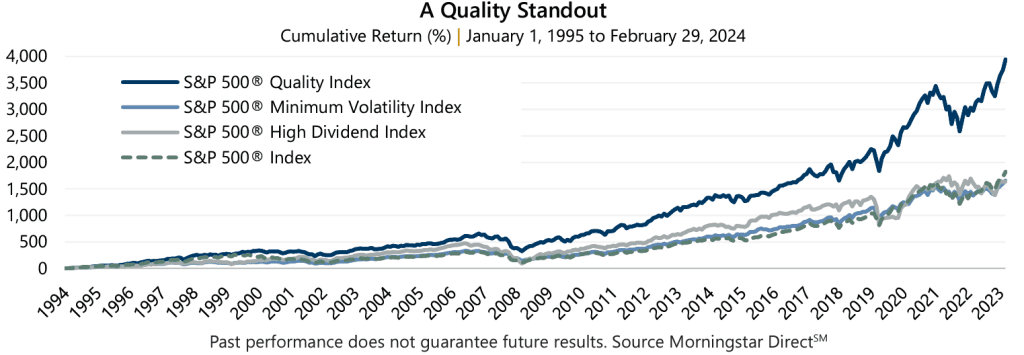
A quick look at performance since January 1995 shows quality outpaced both factors. From the start of 1995 through February 2024, the S&P 500® Quality Index had an annualized return of 13.52%, versus 10.32% for the S&P 500® Minimum Volatility Index, and 10.29% for the S&P 500® High Dividend Index. The broad market, as measured by the S&P 500® Index, returned 10.67% during this time period.