After a very strong first half of 2019, the S&P 500® Index hit a relatively choppy plateau in the third quarter. Though the S&P 500® Index advanced 1.70% for the quarter, its path was not steady as monthly returns came in at 1.44%, -1.58%, and 1.87% in July, August, and September, respectively. The year-to-date return of the S&P 500® Index at the end of the third quarter was 20.55%. The middle of the quarter was particularly volatile as the S&P 500® Index experienced a 5.99% peak-to-trough decline from its all-time high on July 26 through August 14 and had three separate one-day declines of over 2.50% in August. The last time a month included three one-day declines of that magnitude was September 2011 when the equity market was reeling from the credit rating downgrade of U.S. government debt.
Third quarter choppiness was largely driven by the fluctuating tone of U.S. and China trade negotiations. August brought a flurry of exchange over the level and products affected by proposed tariffs from both sides. This back-and-forth contributed to uncertainty in the equity markets and led to daily declines of 2.97%, 2.90%, and 2.59% on August 5, 14, and 23, respectively.
Trade tensions also impacted monetary policy in the third quarter, compelling the Federal Reserve (the Fed) to lower its benchmark overnight lending rate a quarter point at its meeting at the end of July and again in mid-September. Uncertainty over trade policy was cited as a key risk to continued economic expansion and the rate cuts were characterized as a “mid-cycle policy adjustment” and “insurance” against economic retrenchment. The Fed also adjusted its policy on the size of its balance sheet in September. After more than a year of allowing its balance sheet to shrink as bonds it owned matured, the Fed restarted asset purchases to address a lack of liquidity in the overnight lending market. The Fed had not engaged in such an operation since the depths of the financial crisis more than a decade ago. The Fed’s action helped calm markets that had been unnerved by a spike in overnight lending rates.
Despite the uptick in uncertainty and volatility, U.S. economic and corporate earnings data were generally positive. The third estimate of Gross Domestic Product growth for the second quarter of 2019 was 2.0%, near the upper range of consensus expectations. Corporate earnings decelerated a bit but remained positive as aggregate operating earnings for S&P 500® Index companies grew nearly 1% in the second quarter and more than 10% year-over-year. More than 82% of these companies reported second quarter earnings that met or exceeded analyst estimates. The employment situation held steady throughout the third quarter with the unemployment rate at 3.7% as reported for August. The August Consumer Price Index, released on September 12, showed a 1.7% year-over-year increase, in line with expectations.
Implied volatility, as measured by the Chicago Board Options Exchange (Cboe®) Volatility Index (VIX®), averaged 15.96 for the quarter. VIX® exceeded S&P 500® Index realized volatility, as measured by its annualized standard deviation of daily returns, of 14.84% for the quarter. Despite a sizeable peak-to-trough decline that included multiple days of large losses, VIX® response to mid-quarter equity market declines was relatively subdued compared to periods with similar declines. VIX® high for the quarter was 24.59 and it averaged just 18.98 for the month of August. VIX® levels in July were the lowest of the quarter, bottoming at 12.07 on July 24 before peaking at 24.59 on August 5 as U.S. – China trade tensions ratcheted higher in August. VIX® ended the third quarter at 16.24.
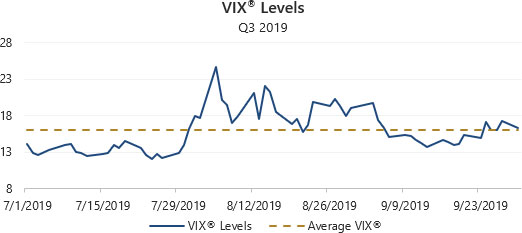
Source: Bloomberg, L.P.
The Cboe® S&P 500 BuyWriteSM Index1 (the BXMSM) returned 0.56% in the third quarter of 2019, bringing its year-to-date return to 10.88%. On the third Friday of each month of the quarter, the BXMSM wrote a new index call option as the option it wrote the previous month expired. The premiums the BXMSM collects on written options have significant influence on its rate of return when the equity market advances and its amount of downside protection when the market declines. Premiums collected as a percentage of the BXM’sSM underlying value were 1.12%, 1.95% and 1.11% in July, August and September, respectively. With corresponding monthly returns of 1.06%, -1.14% and 0.65%, the BXMSM underperformed the S&P 500® Index in July and September, while providing 44 basis points (bps) of downside protection in August. Overall, downside protection in August did not make up for the BXM’sSM underperformance in July and September. During the 5.99% drawdown experienced by the S&P 500® Index between July 26 and August 14, the BXMSM provided 142 bps of downside protection.
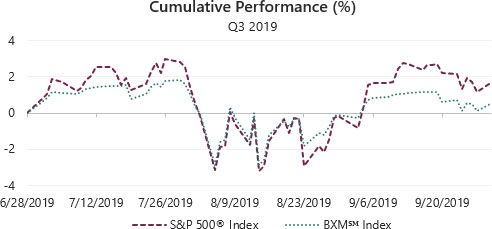
Source: Bloomberg, L.P.
Performance data shown represents past performance and is no guarantee of, and not necessarily indicative of, future results.
The Cboe® S&P 500 BuyWriteSM Index1 (the BXMSM) returned 0.56% in the third quarter of 2019, bringing its year-to-date return to 10.88%. On the third Friday of each month of the quarter, the BXMSM wrote a new index call option as the option it wrote the previous month expired. The premiums the BXMSM collects on written options have significant influence on its rate of return when the equity market advances and its amount of downside protection when the market declines. Premiums collected as a percentage of the BXM’sSM underlying value were 1.12%, 1.95% and 1.11% in July, August and September, respectively. With corresponding monthly returns of 1.06%, -1.14% and 0.65%, the BXMSM underperformed the S&P 500® Index in July and September, while providing 44 basis points (bps) of downside protection in August. Overall, downside protection in August did not make up for the BXM’sSM underperformance in July and September. During the 5.99% drawdown experienced by the S&P 500® Index between July 26 and August 14, the BXMSM provided 142 bps of downside protection.
Sources: Morningstar DirectSM, Bloomberg, L.P. Performance data shown represents past performance and is no guarantee of, and not necessarily indicative of, future results.
1The BXMSM is a passive total return index designed to track the performance of a hypothetical buy-write strategy on the S&P 500® Index. The construction methodology of the index includes buying an equity portfolio replicating the holdings of the S&P 500® Index and selling a single one-month S&P 500® Index call option with a strike price approximately at-the-money each month on the Friday of the standard index-option expiration cycle and holding that position until the next expiration.