The S&P 500® Index returned a staggering 56.35% for the 12-month period ending March 31 while the Bloomberg Barclays U.S. Aggregate Bond Index (the Agg) returned just 0.71%. This disparity has helped intensify the asset allocation debate. A troublesome narrative is taking hold that implies investors have no choice but to endure the risks of the equity market, but risk management remains essential and recent market conditions favor managing risk with index options.
As the stock market continued its upward charge and reached new heights in the first quarter, the Agg posted its worst quarterly return in nearly 40 years. Though the increase in interest rates that drove the bond market bloodbath makes bonds slightly more attractive going forward, the 1.74% yield the U.S. 10-Year Treasury Note sported at quarter-end would be considered paltry relative to its level at just about any other point in history outside the preceding 10 months.
The state of the bond market is such that, despite current equity market valuations at levels not seen since the tech bubble was about to pop, some investors believe there is no alternative to stocks when it comes to making investment allocation decisions. The concept, referred to as “TINA”, gets frequent mention in social media as well as on the pages and airwaves of the major financial press.
While low and rising interest rates change the value proposition for using bonds to manage portfolio risk, financial professionals should resist the idea that investors who find bonds unappealing have no choice but to face the vagaries of the equity market without protection.
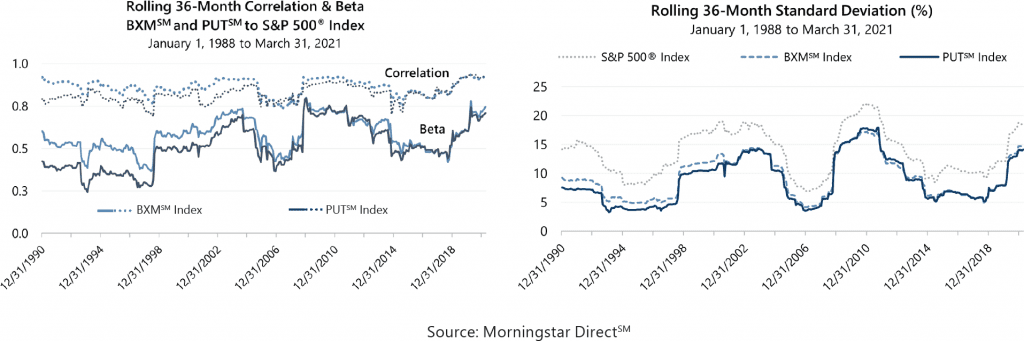
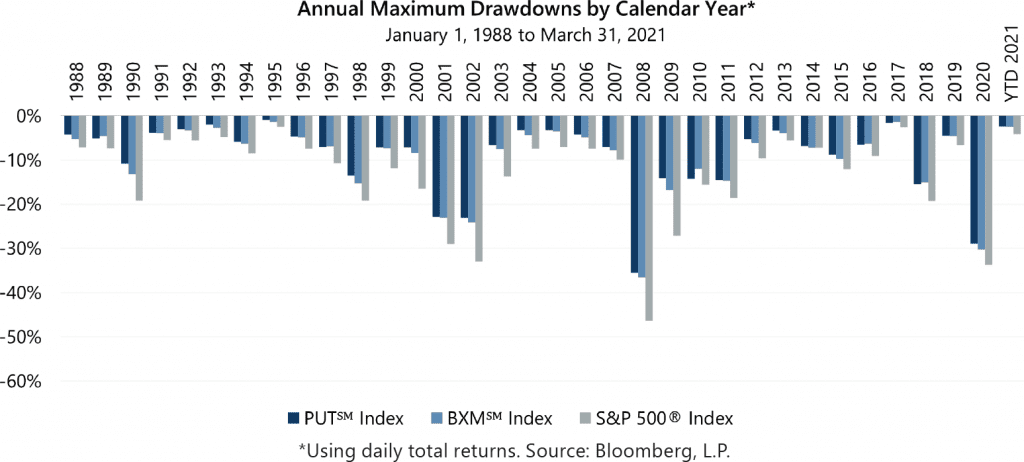
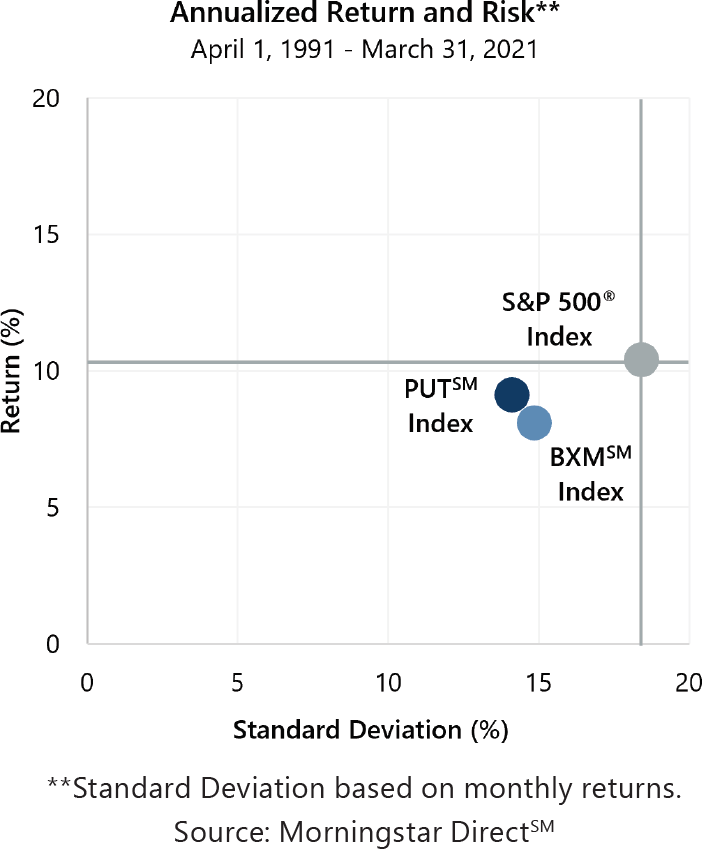
Risk management strategies that combine equity market exposure with premiums from writing index options have the potential to reliably lower risk while enhancing risk-adjusted return. Option writing indexes like the Cboe® S&P 500 BuyWriteSM Index (the BXMSM)i and the Cboe® S&P 500 PutWriteSM Index (the PUTSM)i have a multi-decade history of exhibiting a consistent low-volatility equity profile: high equity market correlation with lower standard deviation and smaller losses. Over the long-term, this profile has historically delivered what many investors with diversified portfolios seek: earning a majority of the equity market’s return at a lower level of risk.
It is worth noting that investor demand for bonds increased after March 2020. Net flows into domestic bond mutual funds and exchange traded funds in the last nine months of 2020 totaled nearly $500 billion dollars, 2% above the full-year total for 2019 and nearly 70% higher than 2012, the next highest annual total in the previous 10 years.
Short spurts of high returns followed by low or negative returns is a pattern that has been in place for a number of years. While the trend of declining longer-term annualized returns for the Agg was interrupted by plummeting interest rates in response to the pandemic, the downward trend in longer-term bond market returns may likely resume unless another crisis drives interest rates back down.
In addition to the potential for low long-term returns, an increased frequency of sharp losses has also emerged as a characteristic of the bond market during low interest rate periods. This phenomenon was particularly visible in long-term government bonds. The nearly 12% drawdown for the Bloomberg Barclays Long-Term U.S. Treasury Index from the beginning of 2021 through February 25 was the 11th double-digit intra-year drawdown for the index since 1987. Such large losses used to be rare, but the 2021 drawdown was the seventh double-digit loss since 2009.
Active management of written index options can achieve a risk profile tailored to specific investor preferences and potentially deliver improved results relative to passive, rules-based option writing indexes. Additionally, index put buying can be combined with index option writing to achieve lower risk profiles and enhanced downside protection.
Risk-reduction from index option writing is largely a function of the amount of premium collected, which is closely tied to how much future volatility is implied by the prices of index options. Option premiums increase with expectations of future, or implied, volatility. Implied volatility is measured by the Cboe® Volatility Index (the VIX®), and while it has come down significantly relative to the extreme highs of March 2020, it remained elevated in the first quarter of 2021. In fact, March was the 13th consecutive month that the VIX® average was above 20 (it’s long-term average is 19.50) – the longest such streak since the 21-month streak that ended in February 2010. Higher implied volatility results in larger premiums received from option writing and potentially improved risk reduction and greater cushion against equity market losses.
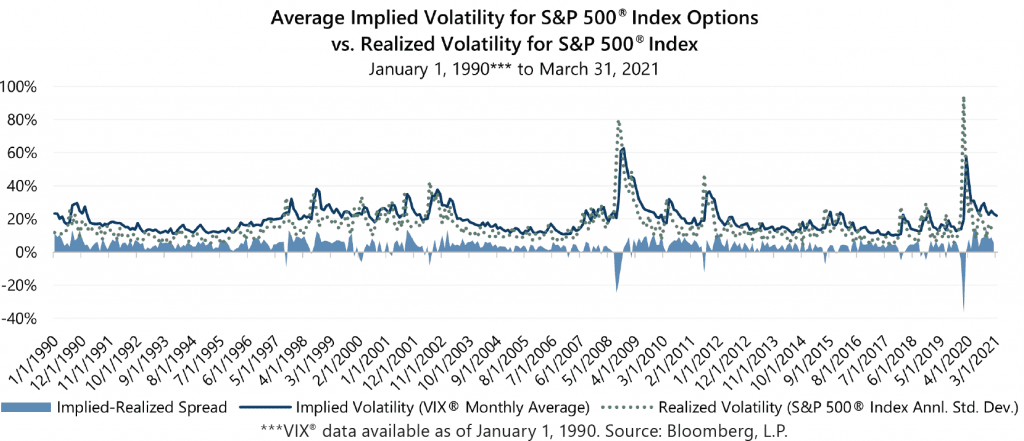
In addition to reliably lowering risk, index option writing strategies have the potential to enhance risk-adjusted return from exposure to the Volatility Risk Premium (VRP), i.e. the propensity of the index option market to overprice risk. VRP is measured as the differential between implied volatility and the actual realized volatility the equity market experiences, measured by its standard deviation of returns. VRP fluctuates over time, but as the following chart shows, on a monthly basis the differential between implied and realized volatility is frequently positive and has averaged 4.1% since 1990. Recently, implied volatility has been much more overpriced than usual and this level of overpricing has been sustained for a record period of time. As of March 2021, for the first time in the history of the VIX®, the spread between implied and realized volatility has been more than double the average quarterly spread for three consecutive quarters.
Interest rates are low, but equity market risks remain high. Going all-in on stocks because the bond market may malfunction is like stepping on a car’s accelerator because the brakes do not work. Risk management remains paramount for investors. Reducing risk while enhancing risk-adjusted return with index option strategies may be the alternative that investors need most.
1The BXMSM is a passive total return index designed to track the performance of a hypothetical buy-write strategy on the S&P 500® Index. The construction methodology of the index includes buying an equity portfolio replicating the holdings of the S&P 500® Index and selling a single one-month S&P 500® Index call option with a strike price approximately at-the-money each month on the Friday of the standard index-option expiration cycle and holding that position until the next expiration.
i The PUTSM is a passive total return index designed to track the performance of a hypothetical portfolio that sells S&P 500® Index put options against collateralized cash reserves held in a money market account. The PUTSM strategy is designed to sell a monthly sequence of S&P 500® Index puts and invest cash at one- and three-month Treasury Bill rates. The monthly sequence entails writing one-month S&P 500® Index put options with a strike price approximately at-the-money each month on the Friday of the standard index option expiration cycle and holding that position until the next expiration. The number of put contracts with identical strike prices and expiration dates sold varies from month to month but is limited so that the amount held in Treasury Bills can finance the maximum possible loss from final settlement of the S&P 500® Index puts.