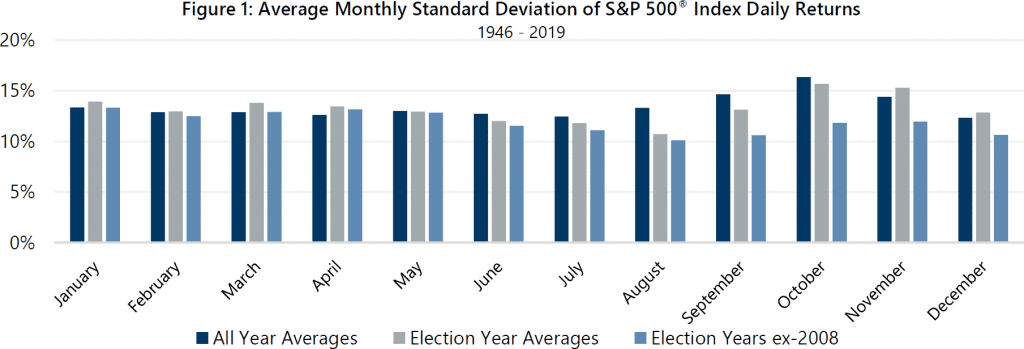
Typically, presidential election years feature below-average equity market volatility. Volatility levels tend to decline from the first half to the second half of election years, with volatility levels in the first half more similar to non-election years. Needless to say, 2020 has not been typical. Moreover, volatility futures markets are indicating an expectation that abnormal volatility levels will continue over the remainder of the year. How should investors prepare for a potentially volatile fourth quarter?
Figure 1 illustrates the counter intuitive pattern of typical presidential election years. On average, presidential election years experience their highest volatility months in the first four months of the year, followed by declining volatility in the summer months and rising volatility toward year-end, though volatility levels in the last three months have tended to stay below average in most election years. Of course, every year is different and 2008 stands out as a year that did not follow the typical election year pattern. However, the extreme volatility levels in the final months of 2008 were driven far more by the Great Financial Crisis than by election year dynamics. To eliminate the impact of the Great Financial Crisis on the volatility pattern of election years, 2008 was removed from the dataset represented by the light blue bars.
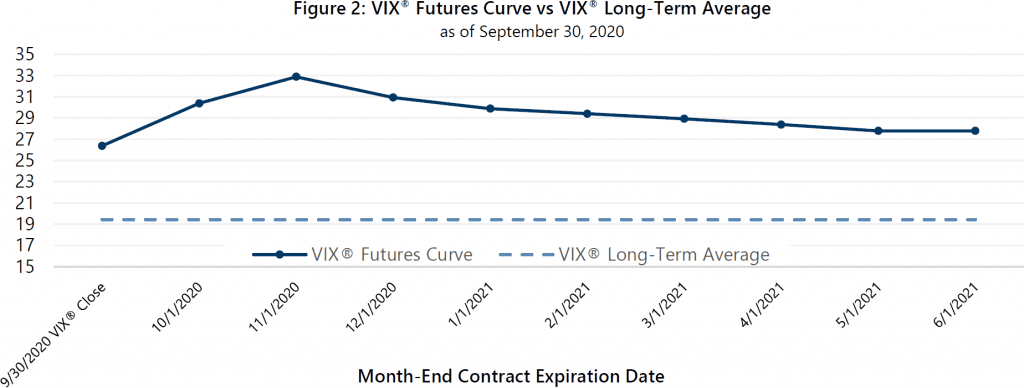
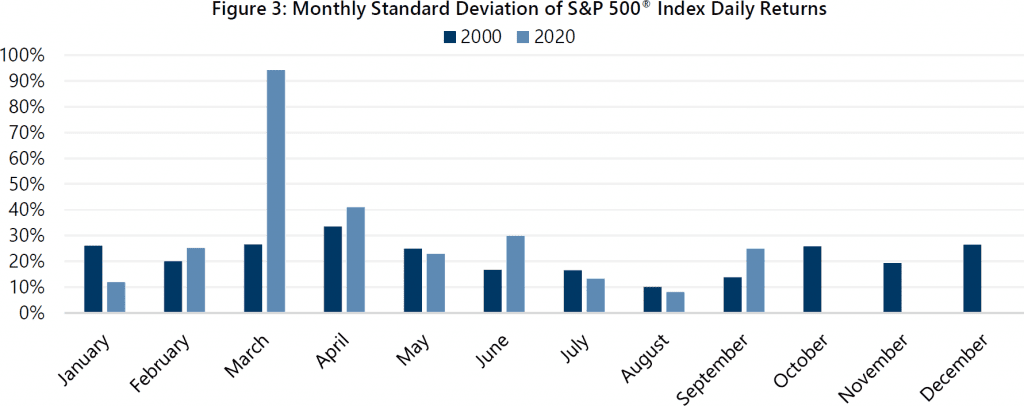
One aspect of volatility levels in 2020 has been consistent with the typical pattern of presidential election years: declining volatility in the summer months followed by an increase in September (see Figure 3, below). Interestingly, volatility this August was below average, even for an election year, while September volatility was above average, relative to both election years and non-election years. The well-above-average volatility of September and the recent shape of the volatility futures curve suggest that investors should be prepared for a fourth quarter that is significantly different than a typical election year. At the end of September 2020, month-end expirations of the Cboe® Volatility Index (the VIX®) futures contracts, reflected expectations of above-average volatility for the remainder of the year.
The year 2000 stands out as a year in which the presidential election had an impact on equity market volatility. It may be an apt comparison to this year as expectations of elevated volatility in the fourth quarter may be associated with the possibility of an uncertain election outcome rather than the market’s anticipated response to a clear victory by one candidate. Weeks after election day, the election of 2000 was ultimately decided by a Supreme Court decision that resulted in Florida’s electoral college votes being allocated to George W. Bush. Bush’s opponent, Al Gore, conceded on December 13, 2000. With the COVID-19 pandemic leading to expanded vote-by-mail options, some investors anticipate greater-than-usual potential for a delay in this year’s election results.
In addition to elevated volatility, the fourth quarter of 2000 also featured a decline of 7.82% for the S&P 500® Index, with a November return of -7.88% and a slight loss and a slight gain for the months of October and December, respectively.
Will election results, or lack thereof, lead to higher equity market volatility? As always, Gateway will take a wait-and-see approach rather than try to anticipate the outcome of events and market direction. We believe it is prudent for long-term investors to be prepared to stay invested through a wide range of possible outcomes. Our risk-first approach is focused on keeping the risk profiles of our strategies as consistent as possible. A potential benefit of the elevated volatility that has existed recently is that it has resulted in increased cash flow potential for the option-writing components of our strategies: higher volatility results in higher option premiums and increased cash flow from option writing. Higher cash flow can result in attractive equity market participation in the event that market volatility is expressed to the upside, at the same time, higher cash flow can result in significant downside protection if volatility is associated with a downside event. As the remainder of 2020 unfolds, Gateway’s investment team will be vigilantly monitoring option markets for opportunities to enhance cash flow in an effort to help our investors meet their long-term goals.
*For more information and access to additional insights from Gateway Investment Advisers, LLC, please visit www.gia.com/insights.