Implied volatility levels plummeted in November. With election uncertainty in the rearview mirror and news of significant progress on COVID-19 vaccines, the Cboe® Volatility Index (the VIX®) declined from 38.02 on October 30 to 20.57 on November 30. The 45.90% drop is the largest month-to-month decline in VIX® history.
While some market watchers may point to the decline in the VIX® as an “all clear” sign for investors, a closer examination reveals a more complex set of insights. Though implied volatility has declined significantly, a case can be made that it should be even lower. Moreover, the fact that the VIX® did not decline below its long-term average of 19.46 during the positive conditions of November is both an indication that perceived risk remains elevated and an encouraging development for investors seeking to manage equity market risk with index option selling.
Equity market conditions in November were consistent with the type of environment in recent years in which the VIX® has been well below average and even approached cyclical lows. Specifically, in the 10 years prior to 2020, the VIX® has averaged less than 14 during months that have featured a combination of above-average return and a new all-time high price for the S&P 500® Index. The strongest evidence that the VIX® should have been even lower in November of this year, however, is the level of realized volatility in the S&P 500® Index, which came in at 16.06% for the month, while the VIX® averaged 25.00. The nearly nine-point spread between the two statistics is more than double the average spread since 1990. In other words, index option prices overvalued realized volatility by more than 55% over the course of the month and overvalued realized volatility by nearly 140% based on the VIX® October closing level.
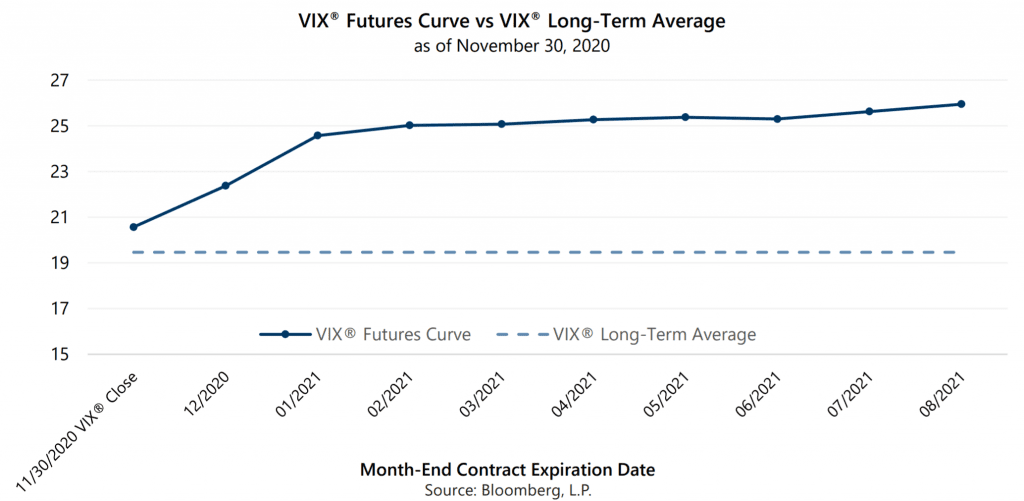
Despite the good news of strong equity market returns and declining volatility in November, risks remain, and it is notable that the VIX® futures curve reflects expectations of rising volatility. Increases in COVID-19 case counts and hospitalizations along with the associated imposition of increased restrictions on economic activity in many parts of the country are clear indications that risk management remains a prudent component of investor portfolios.
While the VIX® futures curve reflects investor expectations of rising volatility as the calendar transitions to the new year, it is worthy of mention that, as with the anticipation of election-related volatility, volatility levels reflected in futures markets may not come to pass.
Up trending equity markets combined with implied volatility levels that are significantly higher than realized volatility are a beneficial combination of market conditions for investment strategies that generate cash flow from index option writing. How long this set of conditions persists remains to be seen. As always, Gateway will look for opportunities to take advantage of the current environment while vigilantly preparing to take appropriate action should conditions change.
*For more information and access to additional insights from Gateway Investment Advisers, LLC, please visit www.gia.com/insights.