Increased volatility in 2020 associated with COVID-19 caused the standard deviation of the S&P 500® Low Volatility Total Return Index1 (the SPLVI) to climb to a higher level than that of the S&P 500® Index. Moreover, the SPLVI Index had a larger peak-to-trough loss than the S&P 500® Index as well.
While the SPLVI exhibited higher risk than the S&P 500® Index, the Cboe® S&P 500 BuyWriteSM Index2 (the BXMSM), in contrast, exhibited lower risk than the S&P 500® Index through the first half of 2020. The BXMSM had a lower standard deviation than the S&P 500® Index (Chart 1) and it continued its streak of smaller peak-to-trough losses (Chart 2).
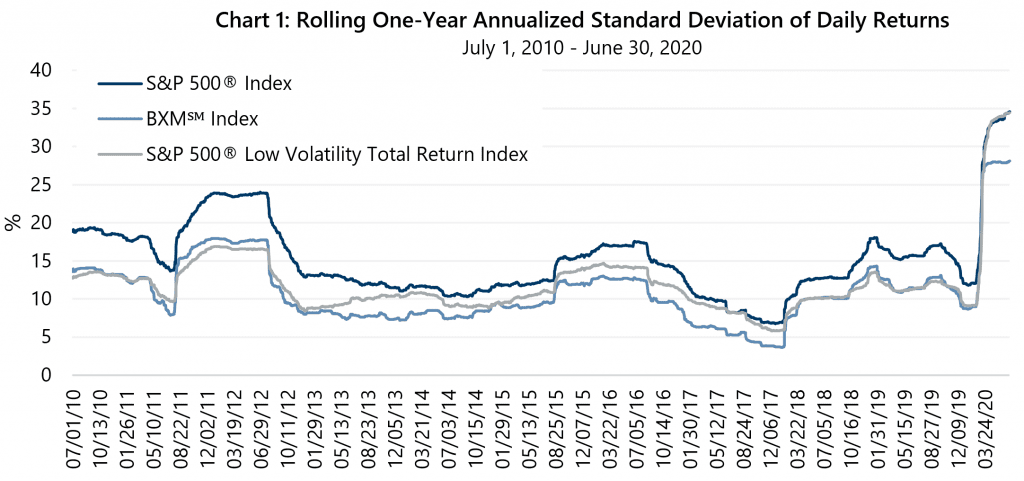
Over the 10-year period shown, the one-year standard deviation of the BXMSM was 29% lower than the S&P 500® Index, on average, while lowering standard deviation by at least 5% and by as much as 48% relative to the S&P 500® Index. The SPLVI lowered standard deviation relative to the S&P 500® Index by 20%, on average, and by as much as 37%. However, during the recent spike in equity market volatility, the SPLVI’s standard deviation actually exceeded the standard deviation of the S&P 500® Index from April 13, 2020 through June 24, 2020.
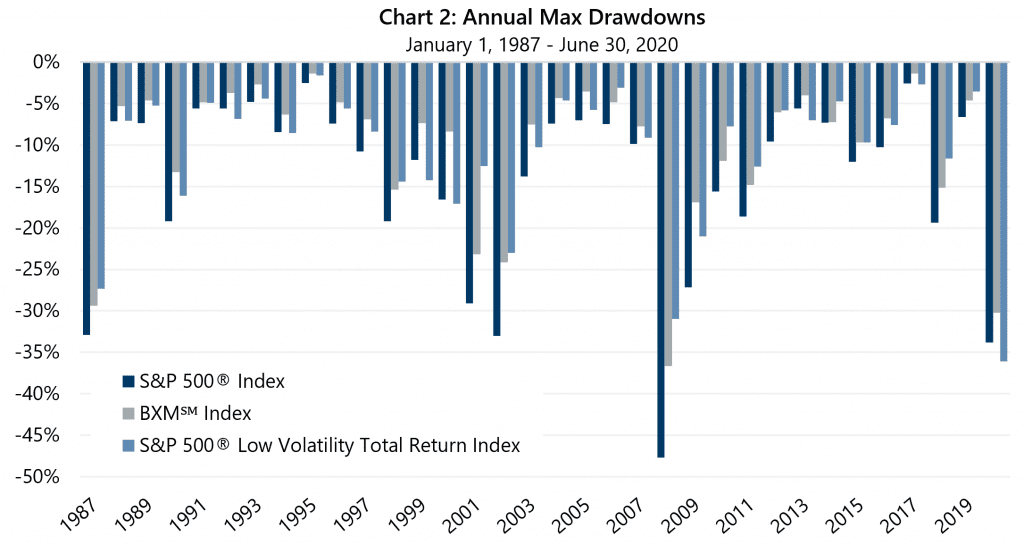
The BXMSM had a smaller drawdown than the S&P 500® Index each year. The SPLVI had a larger drawdown than the S&P 500® Index in 7 of 34 years. The BXMSM had a smaller drawdown than the SPLVI in 22 of 34 years.
As the history of the BXMSM illustrates, the combination of broad-based equity market exposure and written index call options has been a reliable method for reducing equity market risk. The mathematical relationship between the change in value of an index and the change in value of an option on the index has resulted in consistently lower volatility, as measured by standard deviation, and smaller losses during equity market declines.
Index call option overwriting reliably produces these characteristics because the value of an index call option tends to go up as the equity market rises and tends to go down as the market declines. Thus, the impact of written, i.e. shorted, index call option tends to offset the impact of market direction on an overwriting strategy’s equity portfolio. That is, the shorted index call option produces losses as the equity market rises and produces gains as the equity market falls.
This mathematical dynamic results in lower variation of return for overwriting strategies relative to long-only equity indexes. This same dynamic results in the reliable downside protection illustrated in Chart 2. Cash received from writing (shorting) index call options offsets at least a portion of equity portfolio losses during equity market declines because the cash premium is “earned” as the shorted index call option decreases in value with the equity market decline. In this way, the cash premium provides a buffer against equity market losses.
While the SPLVI uses low volatility as an input to its construction methodology, its volatility level relative to the S&P 500® Index has been less consistent than that of the BXMSM. Historically, during periods of increasing equity market volatility, this has sometimes resulted in larger losses for the SPLVI relative to both the S&P 500® Index and the BXMSM. Investors interested in equity-based investment strategies that have lower risk than the equity market may find benefit in index call option overwriting strategies as a compliment to, or replacement for, investment approaches with low volatility factor inputs.
1 The S&P 500® Low Volatility Index (the SPLVI) measures the performance of the 100 least volatile stocks in the S&P 500® Index. The index benchmarks low volatility or low variance strategies for the U.S. stock market. Constituents are weighted relative to the inverse of their corresponding volatility, with the least volatile stocks receiving the highest weights.
2 The BXMSM is a passive total return index designed to track the performance of a hypothetical buy-write strategy on the S&P 500® Index. The construction methodology of the index includes buying an equity portfolio replicating the holdings of the S&P 500® Index and selling a single one-month S&P 500® Index call option with a strike price approximately at-the-money each month on the Friday of the standard index-option expiration cycle and holding that position until the next expiration.