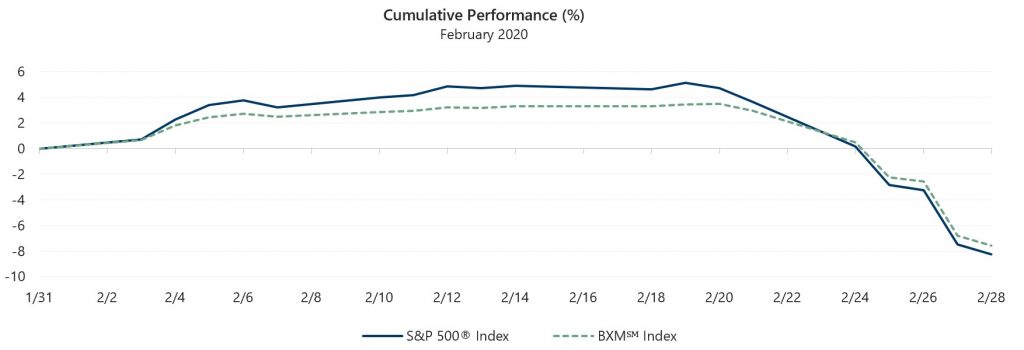
The S&P 500® Index declined 8.23% in February, inciting an intense spike in market volatility. The S&P 500® Index started February on a positive note, climbing 5.12% from the start of the month through February 19. As concerns surrounding the spread of the COVID-19 illness and its potential economic impacts reached a feverish level, the S&P 500® Index rapidly entered correction territory, defined as a decline of 10% or more, with a 12.70% decline from February 19 through month-end. The sharp drop brought the S&P 500® Index’s year-to-date return to -8.27%.
Despite the equity market turmoil, February data releases showed a steady economic environment. The second estimate of Gross Domestic Product growth for the fourth quarter of 2019 was 2.1%, aligned with consensus expectations and the growth rate of the third quarter of 2019. As the labor participation rate climbed from 63.2% to 63.4%, the unemployment rate ticked slightly higher to 3.6% in January. A strong labor force was underlined by a better-than-expected increase in nonfarm payrolls. The January Consumer Price Index, released on February 13, showed a 2.5% year-over-year increase, at the high-end of consensus expectations. With nearly 87% of companies reporting, fourth quarter corporate earnings growth remained positive. Aggregate operating earnings were on track to grow 1.9% quarter-over-quarter and 2.8% year-over-year. Over 77% of companies that have reported earnings met or exceeded analyst estimates.
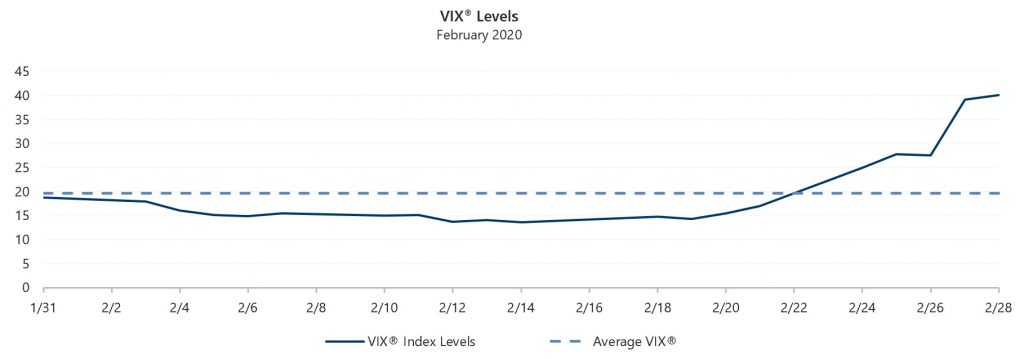
Implied volatility, as measured by the Cboe® Volatility Index (the VIX®), averaged 19.63 in February. The VIX® opened the month at 17.97 before drifting to an intra-month low of 13.68 on February 14. After spiking to an intra-day high of 49.48, its highest level since February 6, 2018, the VIX® proceeded to close the month at 40.11.
Source: Bloomberg, L.P.
The Cboe® S&P 500 BuyWriteSM Index (the BXMSM) declined 7.56% in February, outperforming the S&P 500® Index by 67 basis points (bps). On the third Friday of each month, the BXMSM writes a new index call option as the option it wrote the previous month expires. The premiums the BXMSM collects on its written index call options have significant influence on its return potential over a period when the market advances and helps to mitigate market declines. The premium the BXMSM collected in February helped it return 3.42% from the beginning of the month through February 19, but the premium was not enough to keep pace with the advance of the equity market as the BXMSM lagged the S&P 500® Index by 170 bps. On February 21, the BXMSM wrote a new index call option with a March expiration as its February option expired. The premium collected on the new index call option as a percentage of the BXM’sSM underlying value was 1.51% and it helped provide downside protection as the market declined over the remainder of the month. From February 19 through month-end, the BXMSM returned -10.61%, providing 209 bps of downside protection relative to the S&P 500® Index.
Source: Bloomberg, L.P.
Performance data shown represents past performance and is no guarantee of, and not necessarily indicative of, future results.
The Bloomberg Barclays U.S. Aggregate Bond Index returned 1.80% in February. The yield on the 10-year U.S. Treasury Note (the 10-year) started the month at 1.53% before reaching an intra-month high of 1.65% on February 5. As volatility swept back into the market, the 10-year closed the month at an intra-month low of 1.15%, a new all-time low and 21 bps below its previous all-time low set in July 2016. The shape of the U.S. Treasury yield curve started the month inverted, before resuming an upward sloping curve. However, as equity markets sold-off, the Treasury yield curve inverted once again. The spread between the yield of the 3-month U.S. Treasury Bill and the 10-year started the month of February at a negative three bps, widened to a positive 10 bps, and ended the month at negative 12 bps.
1The BXMSM is a passive total return index designed to track the performance of a hypothetical buy-write strategy on the S&P 500® Index. The construction methodology of the index includes buying an equity portfolio replicating the holdings of the S&P 500® Index and selling a single one-month S&P 500® Index call option with a strike price approximately at-the-money each month on the Friday of the standard index-option expiration cycle and holding that position until the next expiration.