Market shocks come in all sizes and flavors. Sometimes they are a bolt out of the blue with no immediate identifiable trigger, like the flash crash of May 2010 or the event in February 2018 that came to be known as ‘Volmageddon’. Other times the drivers of market volatility are more discernable. As the S&P 500® Index declined 12.70% from its all-time high on February 19 through month-end, and the Cboe® Volatility Index (the VIX®) increased from 14.38 to 40.11, the spreading COVID-19 illness was clearly a catalyst for the spike in volatility. In this way, February’s market shock is more like the collapse of hedge fund Long-Term Capital Management in 1998, the 9/11 terror attacks in 2001 and the bankruptcy of Lehman Brothers in 2008.
What does history tell us about market conditions and equity market returns after such events? As the table below shows, equity market outcomes vary after extreme spikes in volatility, but common characteristics of post-spike periods include elevated market risk, both in terms of realized volatility (standard deviation) and drawdowns. However, equity investors have frequently been rewarded with attractive returns if they maintain equity market exposure through the post-spike period.
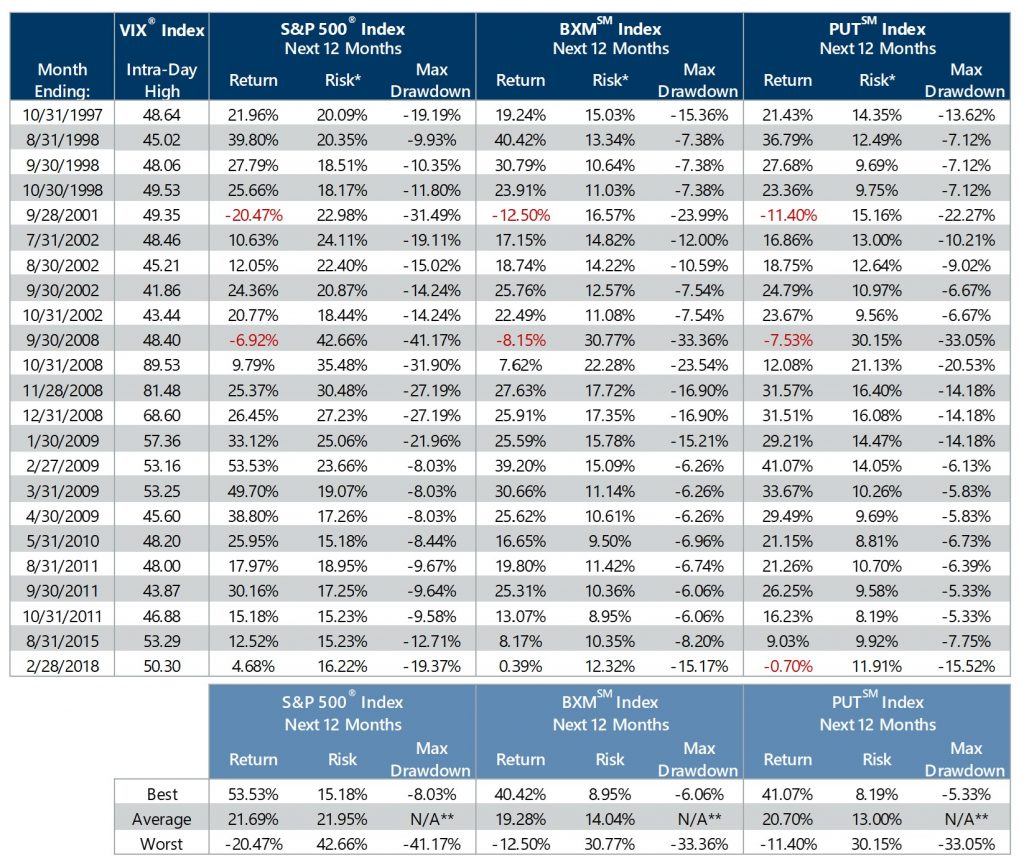
*Risk calculation is annualized standard deviation of daily returns. **Average drawdown is not calculated due to overlapping drawdown periods.
Source: Bloomberg, L.P.
In examining 12-month periods from January 1990 through February 2020, we find that of the 23 post-spike periods (starting at the end of a month which included the VIX® spiking above 40 and ending 12 months later), the total return of the S&P 500® Index has been positive 21 times with an average return of 21.69%. However, in order to get the equity market returns over these periods, investors had to endure additional equity market drawdowns ranging from 8.03% to 41.17%. The Cboe® S&P 500 BuyWriteSM Index (the BXMSM) and the Cboe® S&P 500 PutWriteSM Index (the PUTSM) averaged returns of 19.28% and 20.70%, respectively, over the same periods, while exhibiting lower volatility and smaller drawdowns. On average, the PUTSM delivered over 95% of the S&P 500® Index’s total return at less than 60% of the standard deviation and the BXMSM delivered nearly 90% of the S&P 500® Index’s total return at less than 64% of the standard deviation. The preceding table also shows that the BXMSM outperformed the S&P 500® Index in 9 of the 23 periods and the PUTSM outperformed the S&P 500® Index in 10 periods.
Though 12-month total returns have, on average, been attractive following a dramatic spike in volatility, there also have been two periods in which the market did not fully recover from the additional drawdown after the volatility spike. One of these periods was precipitated by 9/11—in that case the S&P 500® Index had an additional drawdown of over 31% after September 2001 and only a partial recovery by the end of September 2002, resulting in a total return of -20.47%. Similarly, the volatility spike associated with the bankruptcy of Lehman Brothers in 2008 was followed by an additional drawdown of over 41% for the S&P 500® Index from September 30, 2008 to March 9, 2009 and a partial recovery that resulted in a 12-month total return of -6.92% for 12-month period ending September 30, 2009.
When implied volatility increases, the prices of index options generally increase as well. This can benefit index option writing programs similar to those represented by the BXMSM and the PUTSM, as higher option prices generate more cash flow from written options. In turn, the cash flow available to such strategies can potentially result in more equity market participation than usual in the event of a market advance and more protection than usual in the event of a market decline.
Many investors are growing increasingly wary of equity market risks. However, investors may be in need of new or additional sources of lower volatility returns given the low return potential of investment-grade bonds now that yields on U.S. Treasury notes and bonds have fallen to new all-time lows. Too much exposure to low-risk, low-return assets can potentially jeopardize the long-term returns of investor portfolios and create the risk that overall portfolio returns may fall short of those needed to meet long-term goals. Strategies that combine equity market exposure with index option writing may be an attractive solution for investors who need to stay positioned for long-term growth but also need reliable risk reduction and downside protection.
1The BXMSM is a passive total return index designed to track the performance of a hypothetical buy-write strategy on the S&P 500® Index. The construction methodology of the BXMSM includes buying an equity portfolio replicating the holdings of the S&P 500® Index and selling a single one-month S&P 500® Index call option with a strike price approximately at-the-money each month on the Friday of the standard index option expiration cycle and holding that position until the next expiration.
2The PUTSM is a passive total return index designed to track the performance of a hypothetical portfolio that sells S&P 500® Index (SPX) put options against collateralized cash reserves held in a money market account. The PUTSM strategy is designed to sell a monthly sequence of SPX puts and invest cash at one- and three-month Treasury Bill rates. The monthly sequence entails writing one-month SPX put options with a strike price approximately at-the-money each month on the Friday of the standard index option expiration cycle and holding that position until the next. The number of put contracts with identical strike prices and expiration dates sold varies from month to month but is limited so that the amount held in Treasury Bills can finance the maximum possible loss from final settlement of the SPX puts.