The S&P 500® Index returned 11.03% in the fourth quarter, bringing its year-to-date return to 28.71%. The quarter was strong, but uneven, with monthly returns of 7.01%, -0.69% and 4.48% in October, November and December, respectively. The monthly returns mask the extent of mid-quarter volatility as the 9.42% return of the S&P 500® Index from September 30 through November 18 was followed by four weeks of lateral turbulence that included a 4.02% plunge from November 18 through December 1. The equity market ended the year on a high note with a 4.38% advance for the S&P 500® Index from December 20 through year-end.
Macroeconomic data released throughout the quarter indicated modest economic growth, strong corporate earnings, an improving labor market and persistent inflation. The final estimate of Gross Domestic Product for the third quarter of 2021 showed that the U.S. grew at an annualized rate of 2.3%, outpacing the consensus expectation. The unemployment rate declined from 4.6% in October to 4.2% in November, slightly better than the consensus expectation, while the participation rate ticked up to 61.8%. Inflation data was less sanguine as the November Consumer Price Index, released on December 10, showed a 6.8% year-over-year increase, its highest reading since 1982. With nearly all companies reporting, third quarter aggregate operating earnings were on track to climb over 8% quarter-over-quarter while increasing more than 53% year-over-year. More than 83% of the companies that reported earnings met or exceeded analyst estimates.
2021 was the third consecutive year of double-digit return for the S&P 500® Index, powering its three-year cumulative return above 100% for the first time since early March 2012, a three-year period that began at the bear market bottom of the Great Financial Crisis. Additionally, returns were positive in each quarter of 2021, though the September equity market pullback brought that streak to the brink. The equity market started the year in impressive fashion with returns of 6.17% and 8.55% in the first and second quarters, respectively, as macroeconomic stabilization and improvement driven by a relaxation of pandemic mitigation policies and additional fiscal stimulus helped investors digest concerns surrounding the outlook for inflation, labor market imbalances, and rising interest rates. Equity market strength continued in July and August but the S&P 500® Index eked out a third quarter return of just 0.58% as the equity market pulled back, surrendering to a growing list of investor concerns including new COVID variants, the outlook for inflation and uncertainty surrounding fiscal and monetary policy. September’s decline carried into early October as the S&P 500® Index lost 5.12% from September 2 to October 4, its largest peak-to-trough drawdown of the year. The equity market’s fourth quarter was the strongest of all, despite the mid-quarter volatilty, with the S&P 500® Index ending the year just shy of its all-time high reached on December 29.
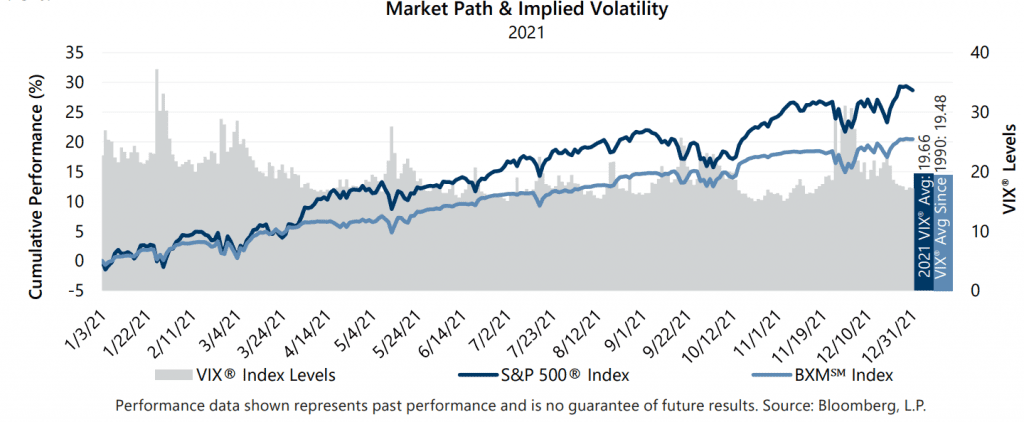
The downtrend in implied volatility that began after the Cboe® Volatility Index (the VIX®) peaked at record levels in March 2020 continued over the first half of 2021. The VIX® spent most of the year ranging from the mid-teens to the low 20s while posting 21 days of closing values above 25, including six days when it closed above 30. The result was an average closing value of 19.66 for the year, slightly above its long-term average of 19.48. While the downtrend brought the measure to below-average levels at various points throughout the year, it never closed below 15, thus establishing a COVID-era low that was above the low readings that persisted for several years prior to the pandemic. Specifically, the VIX® averaged 14.86 during the seven year period from 2013 to 2019. While implied volatility was elevated in 2021, realized volatility, as measured by the standard deviation of daily returns for the S&P 500® Index, was below-average at 13.09% for the year. The spread between S&P 500® Index realized volatility and average implied volatility, often referred to as the Volatility Risk Premium (VRP), was positive in 2021, as is typical. However, the spread was consistently wider than normal as VRP ended the year on a 15-month trend of readings that have been above the historical monthly average of 4.15%.
The Cboe® S&P 500 BuyWriteSM Index1 (the BXMSM) returned 6.98% in the fourth quarter of 2021, lagging the S&P 500® Index by 405 basis points (bps) and bringing its full year return to 20.47%. The BXMSM underperformed the S&P 500® Index in each month of the quarter with returns of 4.67%,-1.50% and 3.77% in October, November and December, respectively. On the third Friday of each month, the BXMSM writes a new index call option as the option it wrote the previous month expires. The premiums the BXMSM collects on its written index call options have significant influence on its return potential during equity market advances and help to mitigate market declines. The premiums the BXMSSM collected as a percentage of the BXM’sSM underlying value were 1.39%, 1.44% and 1.84% in October, November and December, respectively. The BXM’sSM underperformance for the quarter was primarily due to return potential provided by the premium it collected when it wrote its call option with a November expiration on October 15 being insufficient to keep pace with the equity market’s strong advance from mid-October to mid-November. The S&P 500® Index returned 5.21% from October 15 throuth November 19, while the BXMSM returned 1.49%, lagging the S&P 500® Index by 372 bps. While elevated implied volatility levels helped the BXMSM deliver its best annual return since 2009, premiums collected from written index call options were insufficient to keep pace with the seemingly relentless advance of the equity market, resulting in lagging performance for the year relative to the S&P 500® Index. However, index call writing premiums lowered risk relative to the equity market as the BXMSM exhibited a standard deviation of daily returns of 8.61% for 2021 and delivered 320 bps of downside protection with a return of -1.92% during the S&P 500® Index’s maximum drawdown period from September 2 to October 4.
The Bloomberg U.S. Aggregate Bond Index (the Agg) returned 0.01% for the fourth quarter of 2021, resulting in a return of -1.54% for the year. The bond market’s loss for the year, its first annual loss since 2013, was mainly driven by a significant climb in interest rates during the first quarter of the year, which resulted in a first quarter loss of 3.37%, the Agg’s worst quarterly return since the third quarter of 1981. The yield on the 10-year U.S. Treasury Note (the 10-year) opened 2021 at 0.91%, its lowest reading of the year, and reached its 2021 high of 1.74% on March 31 – a level not seen since January 2020. The Agg recovered a portion of its loss in the second quarter as the yield on the 10-year drifted down. The 10-year yield was range bound over the second half of the year and the Agg’s return was flat, earning just 0.06% from June 30 through year-end. The 10-year ended the year with a yield of 1.51%.
1The BXMSM is a passive total return index designed to track the performance of a hypothetical buy-write strategy on the S&P 500® Index. The construction methodology of the index includes buying an equity portfolio replicating the holdings of the S&P 500® Index and selling a single one-month S&P 500® Index call option with a strike price approximately at-the-money each month on the Friday of the standard index-option expiration cycle and holding that position until the next expiration.
Sources: Morningstar DirectSM, Bloomberg, L.P. Performance data shown represents past performance and is no guarantee of, and not necessarily indicative of, future results.
For more information and access to additional insights from Gateway Investment Advisers, LLC, please visit www.gia.com.