The S&P 500® Index returned 12.15% for the fourth quarter of 2020, resulting in a return of 18.40% for the year. The fourth quarter was a mirror image of the third with a loss in the first month rather than the final month as the S&P 500® Index posted a loss of 2.66% for October followed by gains of 10.95% and 3.84% in November and December, respectively.
Macroeconomic data releases during the quarter showed ongoing improvement from the negative effects of persistent COVID-19 mitigation efforts. The final estimate of Gross Domestic Product for the third quarter of 2020 showed that the U.S. economy grew at an annualized rate of 33.4%, outpacing consensus expectations. The unemployment rate improved from 6.9% in October to 6.7% in November, yet the participation rate ticked down from 61.7% to 61.5%. The November Consumer Price Index, released on December 10, showed a 1.2% year-over-year increase, above the consensus estimate of 1.1%. With over 98% of companies reporting, third quarter 2020 aggregate operating earnings were on track to decline 1.52% quarter-over-quarter and 19.35% year-over-year. More than 87% of the companies that reported earnings met or exceeded analyst estimates.
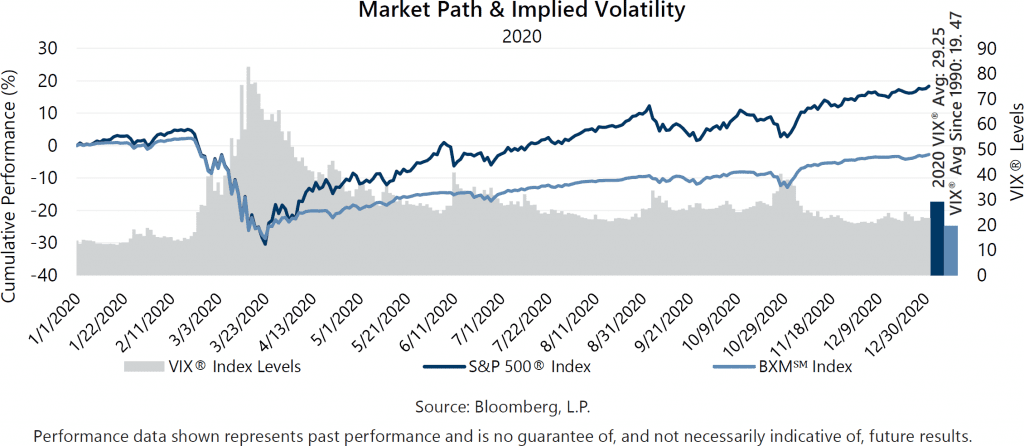
The above-average calendar year return and positive note on which 2020 ended nearly disguised the turmoil with which it began. During the pre-COVID period of January 1 through February 19, the S&P 500® Index returned 5.08% and continued its positive momentum from 2019 as investors reflected on the passage of major global trade deals and strong backward-looking economic data. A pandemic-driven bear market combined with government policies that severely restricted economic activity drove the S&P 500® Index down 33.79% from February 19 through March 23. The recovery from the bear market was led primarily by technology businesses that enabled home-based work, entertainment or shopping and powered the S&P 500® Index to a 61.39% return from March 23 to the recovery period peak on September 2. From September 2 through year-end, the S&P 500® Index returned 5.45%, but the advance was far from steady. The same businesses that powered the recovery period led a decline of 8.48% from September 2 through October 31 as investors processed a resurging pandemic case count and election uncertainty. In November, as election uncertainty faded and progress was made on COVID-19 vaccines, losses from September and October were recovered and the equity market delivered its second highest total return of any November on record. The market continued to trend upward in December with the S&P 500® Index ending the year at a new all-time high.
The economic turmoil caused by the pandemic drove a significant shift in measures of market volatility including realized volatility, implied volatility and the dynamic relationship between the two. Volatility measures at the beginning of the year were consistent with the below-average readings persistent in recent years. The Cboe® Volatility Index® (the VIX®) set a 2020 closing low of 12.10 on January 17 and did not break above its long-term average of 19.47 until February 24, the first day of 2020 in which the S&P 500® Index had a loss exceeding 3%. The VIX® closed at 25.03 on February 24 and rose as high as 85.47 on an intra-day basis on March 18, just shy of its all-time intra-day high reading of 89.53 on October 24, 2008. Realized volatility measures in 2020 were even more extreme. The S&P 500® Index would record 16 more one-day losses exceeding 3%, eight of which occurred in March alone. The large swings resulted in a 93.44% annualized standard deviation of daily returns for the S&P 500® Index in March, the highest reading of monthly standard deviation in history, dating back to 1928. The massive spike in realized volatility caused the largest-ever inversion of the relationship between implied and realized volatility. Typically, implied volatility measures exceed realized volatility, and this relationship has held about 90% of the time on a monthly basis since 1990. Implied volatility averaged nearly 58 for the month of March, based on daily closing values for the VIX®, resulting in a negative 36.5 point spread with realized volatility for the month, an inversion nearly 50% larger than the previous record established in September 2008. While it was extreme, the inversion was temporary as realized volatility normalized more quickly than implied volatility. After implied volatility peaked in mid-March, the VIX® trended lower while remaining persistently above its historical average and spiking above 40 during market pullbacks in June and October. Implied volatility remaining above-average helped normalize the implied volatility versus realized volatility relationship—as the spread not only returned to positive in April but remained positive each subsequent month of the year. Moreover, the August and December measures were the highest and second-highest implied versus realized spreads in history.
The Cboe® S&P 500 BuyWriteSM Index1 (the BXMSM) had a return of 7.54% for the fourth quarter, underperforming the S&P 500® Index Index by 461 basis points (bps) and bringing its return to -2.75% for 2020. On the third Friday of each month, the BXMSM wrote a new index call option as the option it wrote the previous month expired. The premiums the BXMSM collects on written options have significant influence on its return potential over periods when the market advances and help to mitigate losses during market declines. Premiums collected as a percentage of the BXM’sSM underlying value were 2.58%, 1.93% and 1.83% in October, November and December, respectively. With monthly returns of -3.64%, 9.66% and 1.77%, the BXMSM underperformed the S&P 500® Index during each month of the quarter. The BXM’sSM underperformance relative to the S&P 500® Index in October was primarily due to the premium collected by the BXMSM when it wrote its index call option on September 18, providing insufficient return potential to keep pace with the equity market’s rapid advance at the beginning of October. Specifically, the BXMSM generated a return of 1.45% from the beginning of October through October 16 as it earned the remaining time premium from the index call option it wrote in September. However, this was insufficient to keep pace with the 3.67% advance of the S&P 500® Index over the same period. The time premium earned provided 108 bps of downside protection as the equity market declined 6.10% from its closing value on October 16 through month-end. With its written index call option significantly out-of-the-money as November began, the BXMSM was well-positioned for participation in November’s market rally. From November 1 through November 20, the BXMSM returned 8.34%, nearly keeping pace with the 8.94% return of the S&P 500® Index over the same time period. The BXM’sSM underperformance relative to the S&P 500® Index in November and December was primarily due to the premium collected by the BXMSM when it wrote its index call option on November 20 providing insufficient return potential to keep pace with the equity market’s rapid advance at the end of November and beginning of December.
The Bloomberg Barclays U.S. Aggregate Bond Index (the Agg) returned 0.67% for the fourth quarter of 2020, resulting in a return of 7.51% for the year. The yield on the 10-year U.S. Treasury Note (the 10-year) opened the fourth quarter at an intra-quarter low of 0.68%, touched an intra-quarter high of 0.98% on November 11 and ended the year at 0.91%. Bond market returns for 2020 were driven by interest rates that plunged to record lows in response to Fed policy and investor demand for safe-haven assets. The yield on the 10-year opened 2020 at an intra-year high of 1.92% and reached its low for the year of 0.51% on August 4. From the beginning of the year through August 4, the Agg returned 7.87% and, as rates trended up over the remainder of the year, the total return of the Agg turned negative. From its closing value on August 4 through year-end, the Agg returned -0.34%.
1The BXMSM is a passive total return index designed to track the performance of a hypothetical buy-write strategy on the S&P 500® Index. The construction methodology of the index includes buying an equity portfolio replicating the holdings of the S&P 500® Index and selling a single one-month S&P 500® Index call option with a strike price approximately at-the-money each month on the Friday of the standard index-option expiration cycle and holding that position until the next expiration.