August was a fascinating month for volatility statistics. The most surprising stat was that, after July’s record for the widest-ever positive spread between average implied volatility and realized volatility, the spread in August was even wider. The Cboe® Volatility Index (the VIX®) averaged 22.89 in August, lower than July’s average of 26.84, but realized volatility, as measured by the annualized standard deviation of daily returns for the S&P 500® Index, collapsed from 13.28% in July to just 8.10% in August. The plunge in realized volatility caused the spread between the two statistics to increase from 13.56 percentage points in July to a new positive monthly differential of 14.79 percentage points in August.
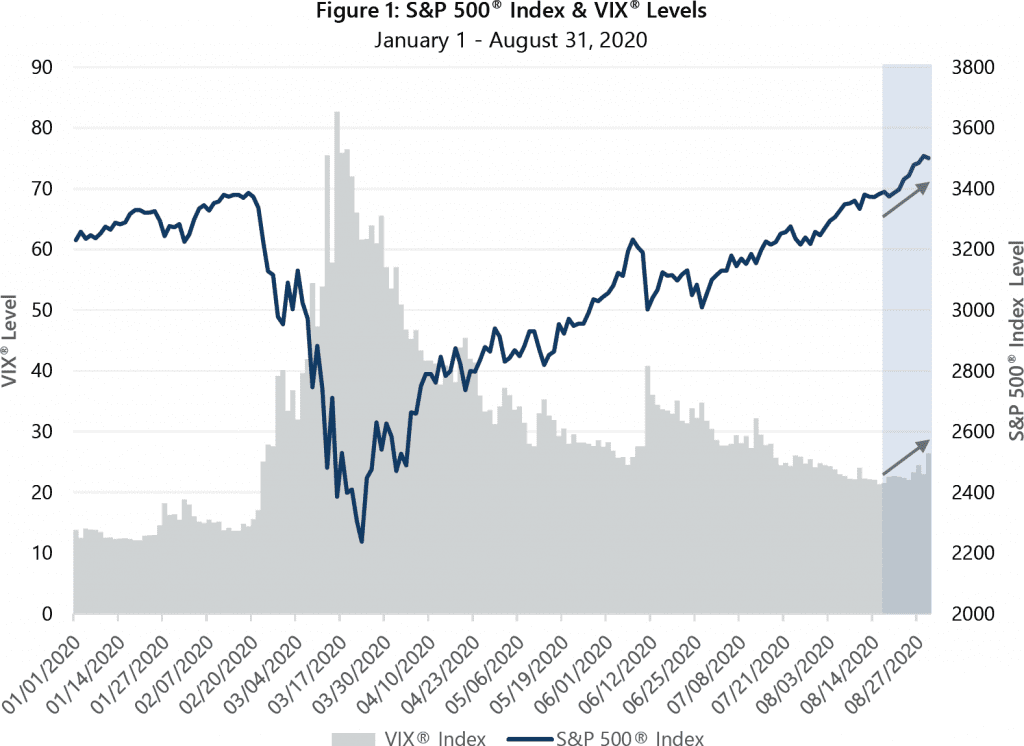
Nearly as surprising as the differential between implied and realized volatility was the upward trend in implied volatility over the last half of August. The VIX® had been in a steady downtrend as the equity market recovered from its March 2020 lows. However, as the S&P 500® Index reached a new all-time closing high on August 18 and continued to advance over the remainder of the month, the VIX® changed course and trended higher in concert with the equity market. The August closing low for the VIX® was 21.35 on August 17. A new all-time high for the S&P 500® Index was set the next day. From that point on, the S&P 500® Index advanced 3.33% through month-end, while the VIX® increased in a fairly steady fashion to end August at 26.41. Typically, the movements of the equity market and the VIX® are inverse—the VIX® tends to decline as the market trends upward and vice versa. Moreover, the tendency in recent years has been for the VIX® to be well-below average when the equity market is setting new all-time highs.
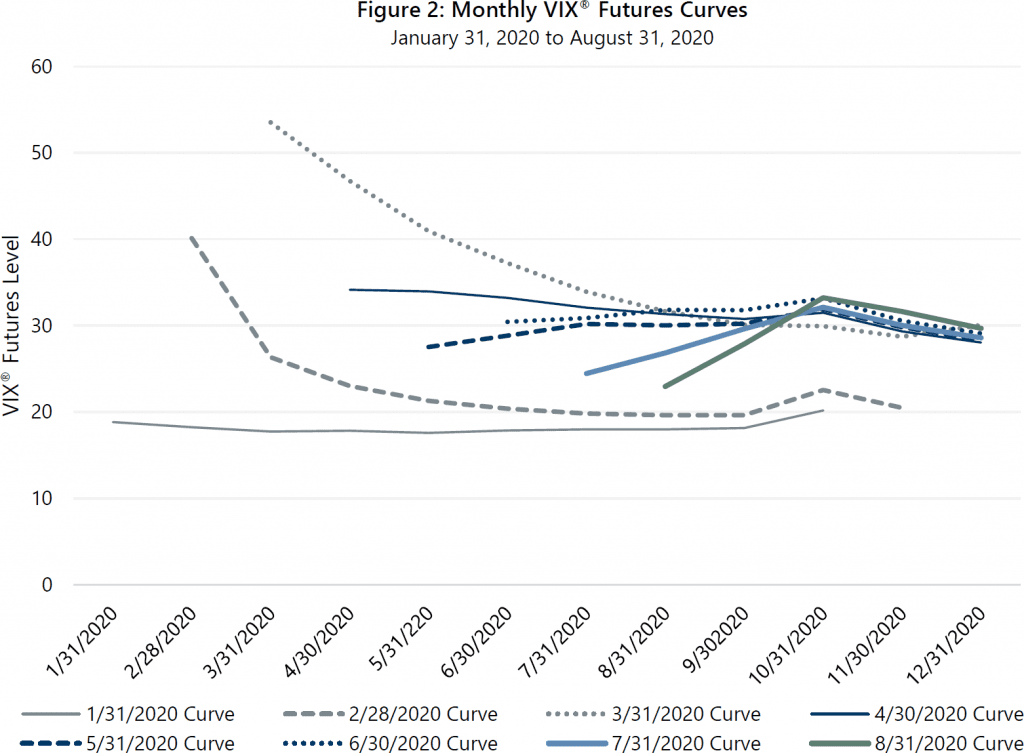
What is causing the surprising behavior of the VIX® relative to the price movement of the equity market? There are many factors that drive volatility pricing, but one of the most interesting factors impacting the current environment may well be the November 2020 election. As the pricing curves for the VIX® futures contracts show, (Figure 2) the market has been pricing in elevated volatility for contracts expiring near the election. The October 31 contract has had a higher price than the September 30 and August 31 contracts for most of the year, and October volatility has been priced higher than the VIX® spot price (current market price) since the end of May. Given the persistence of elevated futures pricing, it is not surprising to see the VIX® climb as the election approaches.
The surprising behavior of the VIX® has potential benefits for strategies that seek to lower risk and enhance risk-adjusted return with index options. With the record level of over-priced volatility in July and August, the risk-adjusted return potential for option writing has never been higher. Even if the spread between implied and realized volatility normalizes, either due to an uptick in realized volatility or a resumption in the downtrend in the VIX®, a positive spread between implied and realized volatility helps maintain attractive return-per-unit of risk for option writing strategies.
Furthermore, the recent uniqueness of the VIX® futures curve creates opportunities for active option management to add value relative to passive or purely systematic option strategies. Option contracts with expiration dates close to the November 2020 election currently have volatility price components that reflect the volatility levels priced into the VIX® futures curve. However, the higher levels of volatility in contracts expiring close to the election relative to nearer-term expirations may not last. By opportunistically extending expiration dates, active managers can benefit from expectations of increasing volatility while equity market conditions remain relatively calm. Record spreads between implied and realized volatility and the abnormality in the shape of the volatility curve may not exist for passive and rules-based strategies that do not happen to utilize contracts with exposure to these potentially beneficial anomalies.
With implied volatility levels still well above the long-term average, strategies that combine equity market exposure with cash flow from writing index options may be particularly attractive to investors interested in strategies that do not invest in bonds but have less risk than pure equity investments. Since 1977, Gateway has utilized a consistent yet flexible and active approach to lowering equity market risk while benefiting from the unique attributes of index options in pursuit of attractive risk-adjusted return.
*For more information and access to additional insights from Gateway Investment Advisers, LLC, please visit www.gia.com/insights.