Is implied volatility low? Like a circle that reveals itself to be a cylinder when you shift your perspective, it depends on how you look at it. On one hand, April 2021 was the first month of below-average implied volatility in over a year, with the Cboe® Volatility Index (the VIX®) averaging 17.42, well below its long-term average of 19.50. On the other hand, the below-average VIX® levels of April were much higher than the equity market’s realized volatilityi, which was below 11%. While implied volatility is typically higher than realized volatility, the spread between the two statistics in April was more than 1.5 times higher than the historical average spread, bolstering the viewpoint that the VIX® is high rather than low.
As Figure 1 illustrates, volatility is cyclical, and its ups and down are driven by multiple factors, including equity market returns and monetary policy. Comparing the current volatility environment to previous low volatility phases with regards to these two factors strengthens the case for interpreting current VIX® levels as remarkably high, rather than simply below average.
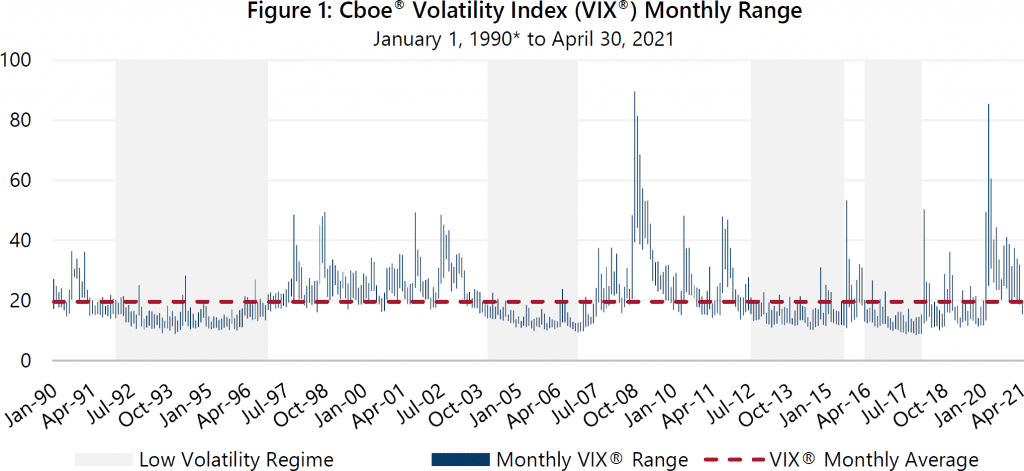
The low volatility periods of July 2012 through July 2015 and March 2016 through January 2018 featured strong equity market returns and extended uptrends wherein the S&P 500® Index frequently set and surpassed new all-time highs. The VIX® tends to decline as the equity market advances and VIX® readings tend to be well below-average when the market reaches new all-time highs. In fact, since 1990, the VIX® has averaged less than 15 on days when the S&P 500® Index registered a new all-time high, well below its long-term average of 19.50. During the two previous low volatility phases, once the S&P 500® Index recovered to a new all-time high, it averaged between three and five new all-time highs per month. Recently, the equity market has been setting new highs at a similar pace. Since reaching full recovery from the COVID-induced bear market in August 2020, 45 new all-time highs have been set, including 25 year-to-date and 10 in the month of April 2021 alone.
The Federal Reserve’s (the Fed) aggressive use of monetary policy and asset purchases to backstop capital markets during the Great Financial Crisis of 2007 – 2008 has had an ongoing impact on the way many investors perceive risk in the context of the Fed’s actions and policy changes. Accommodative monetary policies, including zero percent interest rates and asset purchases that expand the Fed’s balance sheet, have been associated with increased investor demand for risky assets and have had a dampening effect on equity market volatility. During the July 2012 through July 2015 low volatility period, the lower bound of the Federal Funds Target Rate remained at 0%i while the Fed’s balance sheet grew by $1.6 trillion. Most of the balance sheet growth occurred from September 2012 through December 2013 when the Fed executed monthly asset purchases of $45 to $85 billion. Since the onset of the pandemic, Fed policy has been similarly aggressive. The lower bound of Fed Funds has been 0% since March 2020 and the Fed’s balance sheet has expanded by more than $3.6 trillion, with massive emergency purchases in March, April and May of 2020, and steady monthly purchases of $80 billion since last June of 2020.
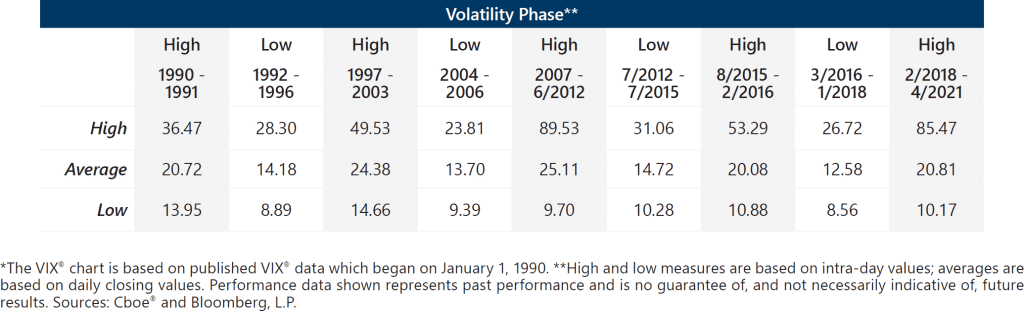
As the table in Figure 1 shows, despite the presence of the volatility dampening forces observed during previous low volatility periods, the 21.72 year-to-date through April 30 average for the VIX® is significantly higher than the VIX® averages of the two previous low volatility phases.
A temporarily down-trending VIX® during a high volatility phase is not uncommon, nor is an uptrend during a low volatility phase. Only time will tell if the downtrend exhibited by the VIX® so far in 2021 is a transition to a low volatility phase or a temporary trend that reverses. Up-trending equity markets combined with elevated implied volatility levels that are significantly higher than realized volatility are a beneficial combination of market conditions for investment strategies that generate cash flow from index option writing. How long this set of conditions persists remains to be seen. As always, Gateway will look for opportunities to take advantage of the current environment while vigilantly preparing to take appropriate action should conditions change.
i Based on the annualized standard deviation of the S&P 500® Index’s daily returns.
ii The lower bound of the Federal Funds Target Rate was 0% from December 2008 through December 2015.