October 2023 Market Recap

The S&P 500® Index returned -2.10% in October, marking the equity market’s third consecutive monthly decline. It appeared monetary policy and the direction of interest rates continued to weigh on investors’ minds while a new conflict abroad added to concerns. These headwinds contributed to an equity market decline of 5.90% from October 11 through October 27. Adding to a decline that began in the third quarter, the S&P 500® Index notched a new 2023 maximum drawdown of -9.94% from July 31 to October 27. The S&P 500® Index has returned 10.69% since the start of 2023.

October 2023 Market Recap

Macroeconomic data released during October suggested a strong backdrop despite rapidly rising interest rates. The first estimate of Gross Domestic Product for the third quarter of 2023 showed that the U.S. grew by an annualized rate of 4.90%, reversing a downward trend over prior months. The September unemployment rate of 3.8% matched the prior month but was worse than the consensus estimate, and the participation rate held steady. The September Consumer Price Index, released October 12, showed a year-over-year increase of 3.70%, higher than expectations but in line with the prior month. On the corporate earnings front, third quarter aggregate operating earnings were on track to climb nearly 2.5% quarter-over-quarter and over 4.8% year-over-year. With just over 57% of S&P 500® Index companies reporting, nearly 82% have met or exceeded analyst estimates.

Implied volatility, as measured by the Cboe® Volatility Index (the VIX®), averaged 18.89 in October. Consistent with its typical relationship, average implied volatility exceeded realized volatility, as measured by the standard deviation of daily returns for the S&P 500® Index, which was 14.12% for the month. The VIX® ended September at 17.52 before reaching an intra-month low of 16.09 on October 11. As the equity market softened, the VIX® climbed to an intra-month high of 21.71 on October 20 before closing the quarter at 18.14.

October 2023 Market Recap

The Cboe® S&P 500 BuyWriteSM Index1 (the BXMSM) returned -0.68% in October, holding up better than the S&P 500® Index and bringing its year-to-date return to 6.60%. The premiums the BXMSM collected as a percentage of its underlying value were beneficial in helping to offset market losses.

The BXMSM is a hypothetical S&P 500® Index buy-write strategy which purchases (buys) an equity portfolio replicating the S&P 500® Index and sells (writes) a single one-month S&P 500® Index call option with a strike price approximately at-the-money. On the third Friday of each month, the BXMSM writes a new index call option as the option it wrote the previous month expires. This passive, rules-based approach makes the BXMSM return subject to the equity market’s path, and the premiums that the BXMSM collects on its written index call options have significant influence on its return potential.

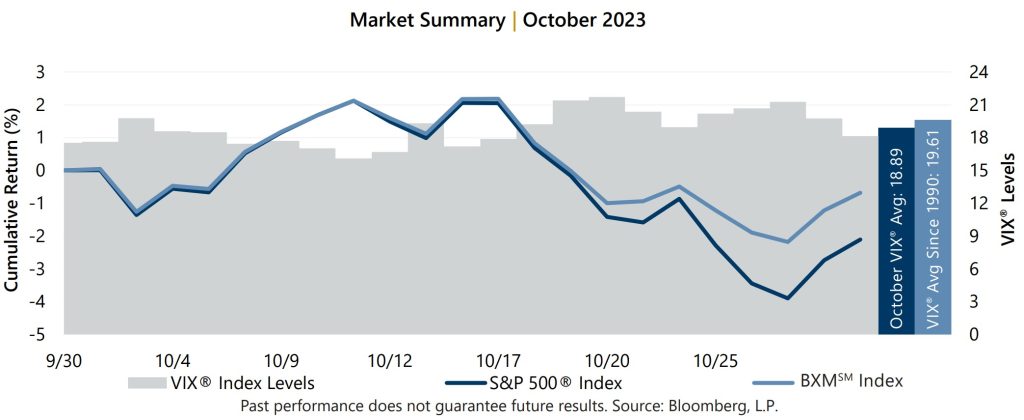
The equity market decline in September positioned the BXMSM to enter October with relatively high market exposure. This passive positioning proved beneficial during the market advance from September 30 through October 11, during which the BXMSM returned 2.13% compared to the 2.12% return of the S&P 500® Index. The BXMSM wrote a new index call option in October, resetting its market exposure amidst a decline and collecting a premium of 2.21%. This option writing premium contributed to 168 basis points (bps) of downside protection during the equity market’s intra-month decline from October 11 to October 27. The BXMSM returned -4.22% compared to the S&P 500® Index return of -5.90% during the period. The BXMSM returned -6.30% during the 2023 equity market max drawdown from July 31 to October 27 as option writing premiums contributed to the 364 bps of downside loss mitigation relative to the S&P 500® Index decline of -9.94%.

October 2023 Market Recap
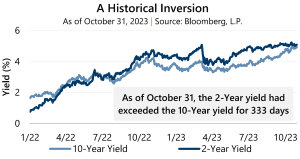
The Bloomberg U.S. Aggregate Bond Index (the Agg) returned -1.58% in October as interest rates continued to climb and the feeling of “higher-for-longer” seemed to settle-in. The Agg has had a rough go in 2023, concluding a six-month losing streak in October with a year-to-date return of -2.77%. The yield on the 10-year U.S. Treasury Note (the 10-year) ended September at 4.57% before reaching an intra-month low of 4.56% on October 11. The 10-year yield then rose to reach a 2023 high of 4.99% on October 19 before closing the month at 4.93%. In a historical inversion that has persisted since July 5, 2022, the yield on the 2-year U.S. Treasury Note exceeded that of the 10-year for the month.

1The BXMSM is a passive total return index designed to track the performance of a hypothetical buy-write strategy on the S&P 500® Index. The construction methodology of the index includes buying an equity portfolio replicating the holdings of the S&P 500® Index and selling a single one-month S&P 500® Index call option with a strike price approximately at-the-money each month on the Friday of the standard index-option expiration cycle and holding that position until the next expiration.

Sources: Morningstar DirectSM, Bloomberg, L.P. Performance data shown represents past performance and is no guarantee of, and not necessarily indicative of, future results.

For more information and access to additional insights from Gateway Investment Advisers, LLC, please visit www.gia.com.

Download: