The S&P 500® Index returned 8.10% in October, bringing its year-to-date return to -17.70%. The month delivered thrills and chills in volatile trading sessions that established new year-to-date lows. Half of the days over the first two weeks witnessed equity market swings of +/- 2% or more, including an intra-day move of more than 5% on October 13, before a strong advance over the second half of the month. From the closing value on September 30 through October 12, the S&P 500® Index declined 0.19%. After setting a new year-to-date closing low on October 12, the S&P 500® Index advanced rapidly through month-end – climbing 8.30%. From its peak on January 3 through October 12, the S&P 500® Index declined 24.49%.
Data released in October showed the U.S. macroeconomic environment and labor market remained resilient despite persistent inflation and an ongoing tightening of monetary policy. The first estimate of Gross Domestic Product for the third quarter of 2022 showed that the U.S. grew by an annualized rate of 2.6%, better than the consensus expectation of 2.3%, and breaking a streak of negative readings. The September unemployment rate of 3.5% improved from the previous month and was better than the consensus estimate, while the participation rate ticked down to 62.3%. The September Consumer Price Index, released October 13, remained near record highs with a year-over-year increase of 8.2%, which was slightly higher than the consensus expectation. Second quarter aggregate operating earnings were on track to decline 2.5% quarter-over-quarter while increasing nearly 17% year-over-year. With over 98% of companies reporting, nearly 80% met or exceeded analyst estimates.
Implied volatility, as measured by the Cboe® Volatility Index (the VIX®), averaged 30.01 in October – its highest monthly average since June 2020. Consistent with its typical relationship, average implied volatility exceeded realized volatility, as measured by the standard deviation of daily returns for the S&P 500® Index, which was 27.95% for the month. The VIX® closed September at 31.62 and climbed to an intra-month high of 33.63 on October 11 before drifting to its intra-month low of 25.75 on October 28. The VIX® closed the month at 25.88.
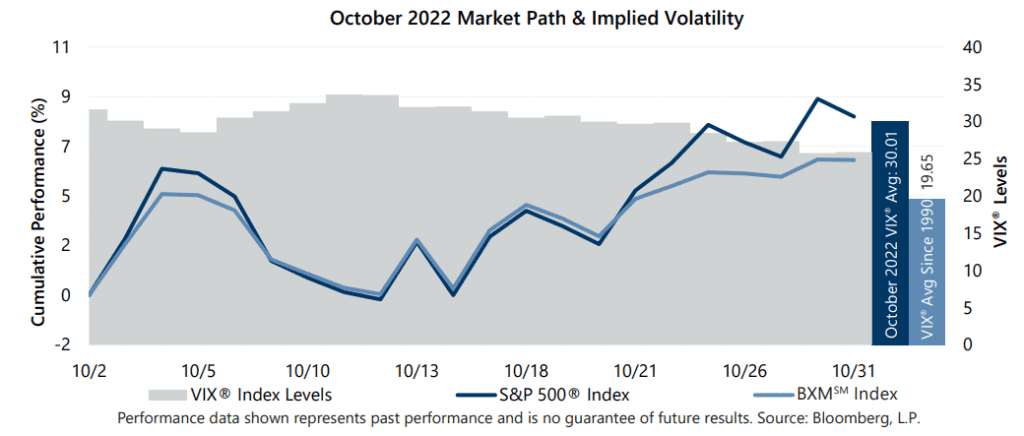
The Cboe® S&P 500 BuyWriteSM Index1 (the BXMSM) returned 6.13% in October, underperforming the S&P 500® Index by 197 basis points and bringing its year-to-date return to -11.92%. On the third Friday of each month, the BXMSM writes a new index call option as the option it wrote the previous month expires. The premiums the BXMSM collects on its written index call options have significant influence on its return potential during market advances and help to mitigate market declines. The market decline at the end of September resulted in the BXMSM starting October with a far out-of-the-money written call option, which increased its participation in the market’s performance during the first part of October. From the beginning of the month through October 20, the day prior to the expiration of its written call option, the BXMSM returned 2.67%, outpacing the S&P 500® Index return of 2.32%. On October 21, the BXMSM wrote a new index call option with a November expiration and collected a premium of 3.65%. The portion of the premium it received contributed to performance but was insufficient in keeping pace with the rapid advance of the equity market throughout the remainder of the month. The BXMSM returned 3.37% from October 20 through month-end, compared to the 5.65% of the S&P 500® Index over the same period.
The Bloomberg U.S. Aggregate Bond Index returned -1.30% in October, bringing its year-to-date return to -15.72%. The yield on the 10-year U.S. Treasury Note (the 10-year) ended September at 3.83%, touched its intra-month low of 3.63% on October 4, then climbed to an intra-month high of 4.24% on October 24. The yield on the 10-year closed the month at 4.05%. Throughout the entire month of October, the yield curve was inverted with the yield on the 2-year U.S. Treasury Note exceeding the yield on the 10-year.
1The BXMSM is a passive total return index designed to track the performance of a hypothetical buy-write strategy on the S&P 500® Index. The construction methodology of the index includes buying an equity portfolio replicating the holdings of the S&P 500® Index and selling a single one-month S&P 500® Index call option with a strike price approximately at-the-money each month on the Friday of the standard index-option expiration cycle and holding that position until the next expiration.
Sources: Morningstar DirectSM, Bloomberg, L.P. Performance data shown represents past performance and is no guarantee of, and not necessarily indicative of, future results.
For more information and access to additional insights from Gateway Investment Advisers, LLC, please visit www.gia.com.