The S&P 500® Index returned 7.01% for the month of October, bringing its year-to-date return to 24.04%. Supported by strong corporate earnings reports, the equity market rebounded from September’s loss as investors managed to look past concerns regarding the outlook for inflation and rising interest rates.
U.S. macroeconomic data released in October was mixed as supply chain and labor market disruptions continued. The first estimate of Gross Domestic Product for the third quarter of 2021 showed that the U.S. grew at an annualized rate of 2.0%, which was below the consensus expectation. The unemployment rate was better than the consensus estimate as it declined from 5.2% in August to 4.8% in September; however, the participation rate ticked down to 61.6%. Inflation outpaced the consensus estimate as the September Consumer Price Index, released on October 13, showed a 5.4% year-over-year increase. Third quarter aggregate operating earnings were on track to climb nearly 8% quarter-over-quarter while increasing more than 53% year-over-year. With over 54% of companies reporting, more than 84% met or exceeded analyst estimates.
Implied volatility, as measured by the Cboe® Volatility Index (the VIX®), averaged 17.87 in October. Consistent with its typical relationship, average implied volatility exceeded realized volatility, as measured by the standard deviation of daily returns for the S&P 500® Index, which was 10.88% for the month. October’s seven-percentage-point spread between S&P 500® Index realized volatility and average implied volatility, often referred to as the Volatility Risk Premium, continued the 13-month trend of readings that have been above the historical monthly average of 4.14%. The VIX® opened October at 21.15 and reached an intra-month high of 22.96 on October 4 before drifting to an intra-month low of 15.01 on October 21. The VIX® closed the month at 16.26.
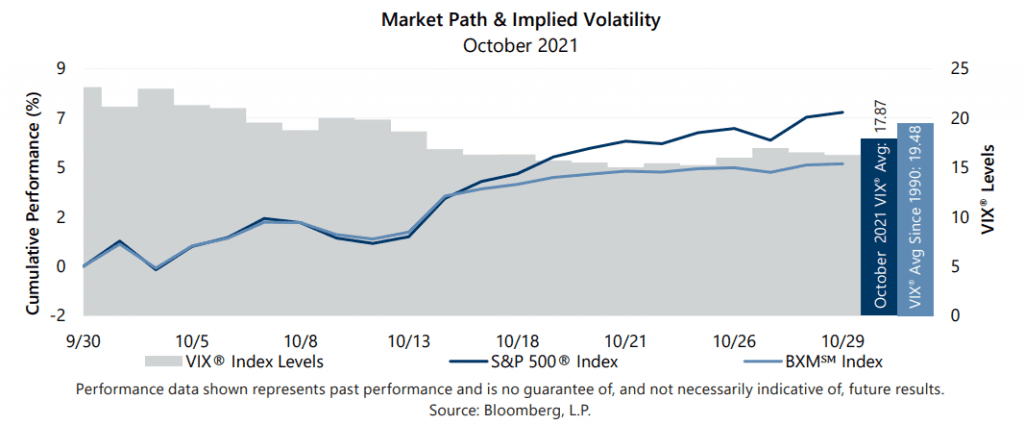
The Cboe® S&P 500 BuyWriteSM Index1 (the BXMSM) returned 4.67% in October, underperforming the S&P 500® Index by 234 basis points (bps) and bringing its year-to-date return to 17.86%. The BXMSM provided downside protection during September’s drawdown, but the premium collected in October was insufficient to keep pace during the equity market’s advance over the last half of October. On the third Friday of each month, the BXMSM writes a new index call option as the option it wrote the previous month expires. The premiums the BXMSM collects on its written index call options have significant influence on its return potential during market advances and help to mitigate market declines. September’s equity market decline resulted in the BXM’sSM written index call option being out-of-the-money (OTM) at the beginning of October. Remaining time premium from the call option written in September plus the relatively high market exposure resulting from the call option being OTM, allowed the BXMSM to outperform the S&P&® 500 Index over the first half of the month. From the beginning of the month through October 14, the day prior to the expiration of its written call option, the BXMSM returned 3.20% while the S&P 500® Index returned 3.09%. On October 15, the BXMSM wrote a new index call option with a November expiration and collected a premium of 1.39%. Earning a portion of the premium it received helped the BXMSM return 1.42% from its closing value on October 14 through month-end, but it lagged the 3.80% advance of the S&P 500® Index by 238 bps over the same period.
The Bloomberg U.S. Aggregate Bond Index returned -0.03% in October, bringing its year-to-date return to -1.58%. The yield on the 10-year U.S. Treasury Note (the 10-year) started October at its intra-month low of 1.46% before climbing to an intra-month high of 1.70% on October 21. The yield on the 10-year then drifted lower to close the month at 1.55%.
1The BXMSM is a passive total return index designed to track the performance of a hypothetical buy-write strategy on the S&P 500® Index. The construction methodology of the index includes buying an equity portfolio replicating the holdings of the S&P 500® Index and selling a single one-month S&P 500® Index call option with a strike price approximately at-the-money each month on the Friday of the standard index-option expiration cycle and holding that position until the next expiration.
Sources: Morningstar DirectSM, Bloomberg, L.P. Performance data shown represents past performance and is no guarantee of, and not necessarily indicative of, future results.
For more information and access to additional insights from Gateway Investment Advisers, LLC, please visit www.gia.com.