The S&P 500® Index returned 9.13% in November, interrupting three consecutive months of decline and capping an impressive advance of 11.18% from its intra-quarter low on October 27 through November 30. This month’s return was the equity market’s ninth highest in the last 35 years, fueled by easing inflation and optimism about the direction of monetary policy. Conflict abroad and geopolitical uncertainty seemed to fade from investor minds in light of growing expectations that the U.S. Federal Reserve has reached the end of its interest rate hiking cycle. The S&P 500® Index has returned 20.80% since the start of 2023.
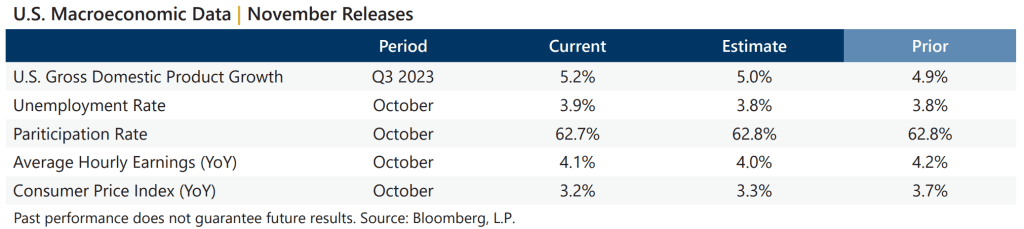
Macroeconomic data released during November continued to reflect a resilient backdrop amid easing inflation. The second estimate of Gross Domestic Product for the third quarter of 2023 showed that the U.S. grew by an annualized rate of 5.20%, outpacing expectations. The October unemployment rate of 3.9% was worse than September’s rate and the consensus estimate, both of which were 3.8%, while the participation rate ticked lower to 62.7%. The October Consumer Price Index, released November 14, showed a year-over-year increase of 3.2%, which was below expectations. On the corporate earnings front, third quarter aggregate operating earnings were on track to climb 1.0% quarter-over-quarter and 3.4% year-over-year. With more than 97% of S&P 500® Index companies reporting, over 84% have met or exceeded analyst estimates.
Implied volatility, as measured by the Cboe® Volatility Index (the VIX®), averaged 14.02 in November. Consistent with its typical relationship, average implied volatility exceeded realized volatility, as measured by the standard deviation of daily returns for the S&P 500® Index, which was 11.17% for the month. The VIX® ended October at 18.14 and reached November’s high of 16.87 on the first of the month. As the equity market rallied, the VIX® reached a 2023 low of 12.46 on November 24 before closing the month at 12.92.
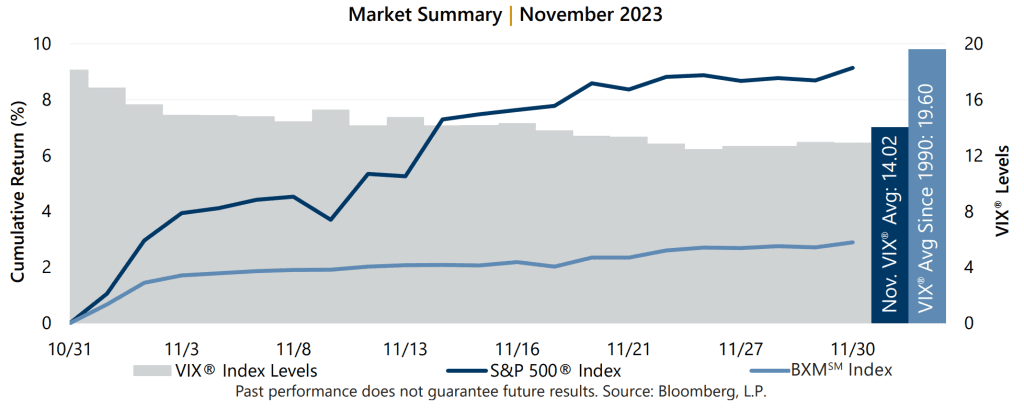
The Cboe® S&P 500 BuyWriteSM Index1 (the BXMSM) returned 2.89% in November, bringing its year-to-date return to 9.69%. The premiums the BXMSM collected as a percentage of its underlying value were insufficient to keep pace with the rapid rise of the market during the month.
The BXMSM is a hypothetical S&P 500® Index buy-write strategy which purchases (buys) an equity portfolio replicating the S&P 500® Index and sells (writes) a single one-month S&P 500® Index call option with a strike price approximately at-the-money. On the third Friday of each month, the BXMSM writes a new index call option as the option it wrote the previous month expires. This passive, rules-based approach makes the BXMSM return subject to the equity market’s path, and the premiums that the BXMSM collects on its written index call options have significant influence on its return potential.
The equity market advance in the final days of October and early November resulted in the BXMSM entering November with relatively low, and declining, market exposure. The passive positioning inhibited market participation for the month. The BXMSM wrote a new index call option in November, resetting its market exposure amidst a rally and collecting a premium of 1.37%. From the equity market’s intra-quarter low through November 30, the BXMSM climbed 4.47% relative to the S&P 500® Index climb of 11.18%.
The Bloomberg U.S. Aggregate Bond Index returned 4.53% in November, breaking a six-month losing streak with its best monthly return in 35 years and bringing its year-to-date return to 1.64%. The yield on the 10-year U.S. Treasury Note (the 10-year) ended October at 4.93% and booked its intra-month high of 4.73% on November 1. The yield on the 10-year drifted to an intra-month low of 4.26% on November 29, before closing the month at 4.33%. In a historical inversion that has persisted since July 5, 2022, the yield on the 2-year U.S. Treasury Note exceeded that of the 10-year for the month.
1The BXMSM is a passive total return index designed to track the performance of a hypothetical buy-write strategy on the S&P 500® Index. The construction methodology of the index includes buying an equity portfolio replicating the holdings of the S&P 500® Index and selling a single one-month S&P 500® Index call option with a strike price approximately at-the-money each month on the Friday of the standard index-option expiration cycle and holding that position until the next expiration.
Sources: Morningstar DirectSM, Bloomberg, L.P. Performance data shown represents past performance and is no guarantee of, and not necessarily indicative of, future results.
For more information and access to additional insights from Gateway Investment Advisers, LLC, please visit www.gia.com.