The S&P 500® Index returned 5.59% in November, bringing its year-to-date return to -13.10%. The market advance was driven by lower-than-expected inflation and hopes that the U.S. Federal Reserve would soon slow its pace of monetary tightening. November’s strong return was a continuation of a climb that began from the year-to-date low established in mid-October and included single day returns of 5.55% and 3.12% for the S&P 500® Index on November 10 and November 30, respectively. Through month-end, the S&P 500® Index has climbed 14.35% from its 2022 low set on October 12, yet remains 13.66% below its year-to-date high set on January 4.
Data released in November showed an expanding U.S. economy and stable labor market despite persistent inflation and ongoing tightening of monetary policy. The second estimate of Gross Domestic Product for the third quarter of 2022 showed that the U.S. grew by an annualized rate of 2.9%, better than the consensus expectation of 2.7%. The October unemployment rate of 3.7% was an increase from the prior month and was slightly worse than the consensus estimate, while the participation rate ticked down to 62.2%. The October Consumer Price Index, released November 10, remained near record highs with a year-over-year increase of 7.7%, which was lower than the consensus expectation. Third quarter aggregate operating earnings were on track to decline 0.7% quarter-over-quarter while increasing over 7% year-over-year. With more than 96% of S&P 500® Index companies reporting, over 75% met or exceeded analyst estimates.
Implied volatility, as measured by the Cboe® Volatility Index (the VIX®), averaged 23.30 in November. The two large single-day advances resulted in realized volatility that exceeded average implied volatility for the month, causing an inversion of the typical relationship between the two statistics. Realized volatility for November, as measured by the standard deviation of daily returns for the S&P 500® Index, came in at 27.95%, more than four percentage points higher than average implied volatility. The VIX® ended October at 25.88, reached an intra-month high of 26.09 on November 9, then drifted to an intra-month low of 20.35 on November 23. The VIX® ended November at 20.58.
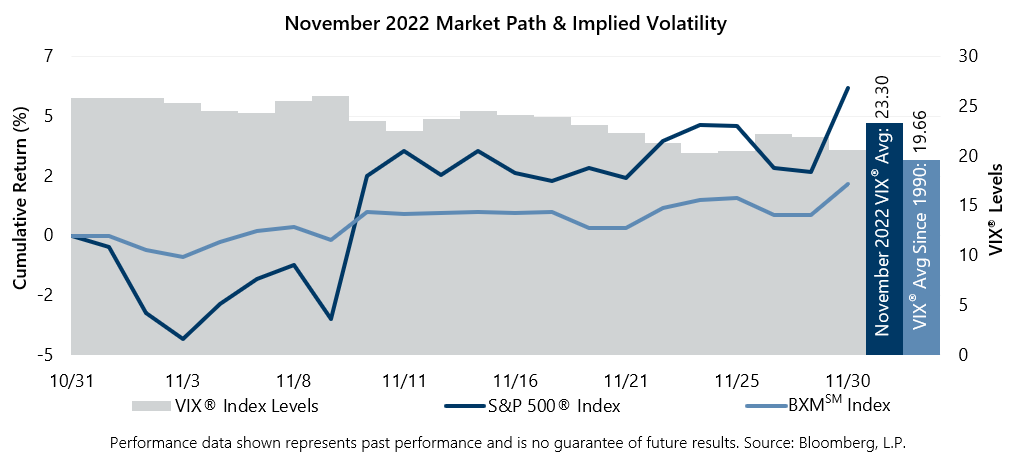
The Cboe® S&P 500 BuyWriteSM Index1 (the BXMSM) returned 1.94% in November, underperforming the S&P 500® Index by 365 basis points and bringing its year-to-date return to -10.21%. On the third Friday of each month, the BXMSM writes a new index call option as the option it wrote the previous month expires. The premiums the BXMSM collects on its written index call options have significant influence on its return potential during market advances and help to mitigate market declines. The BXMSM began the month with an in-the-money written call option due to the market advance during the second half of October. Remaining time premium to earn from its expiring written index call option helped the BXMSM generate a return in the first half of the month, but the lack of market exposure from its in-the-money option resulted in lagging performance relative to the S&P 500® Index. From the beginning of the month through November 17, the day prior to the expiration of its written call option, the BXMSM returned 0.89%, while the S&P 500® Index returned 2.07%. On November 18, the BXMSM wrote a new index call option with a December expiration and collected a premium of 2.42%. Earning a portion of the premium it received contributed to the return of the BXMSM over the remainder of the month but was insufficient to keep pace with the rapid advance of the equity market. The BXMSM returned 1.04% from its closing value on November 17 through month-end, while the S&P 500® Index rallied 3.45% over the same period.
The Bloomberg U.S. Aggregate Bond Index returned 3.68% in November, bringing its year-to-date return to -12.62%. The yield on the 10-year U.S. Treasury Note (the 10-year) ended October at 4.05%, touched its intra-month high of 4.21% on November 7, then closed November at its intra-month low of 3.61%. For the second consecutive month the yield curve was inverted, with the yield on the 2-year U.S. Treasury Note exceeding the yield on the 10-year throughout the month.
1The BXMSM is a passive total return index designed to track the performance of a hypothetical buy-write strategy on the S&P 500® Index. The construction methodology of the index includes buying an equity portfolio replicating the holdings of the S&P 500® Index and selling a single one-month S&P 500® Index call option with a strike price approximately at-the-money each month on the Friday of the standard index-option expiration cycle and holding that position until the next expiration.
Sources: Morningstar DirectSM, Bloomberg, L.P. Performance data shown represents past performance and is no guarantee of, and not necessarily indicative of, future results.
For more information and access to additional insights from Gateway Investment Advisers, LLC, please visit www.gia.com.