The S&P 500® Index returned -0.69% for the month of November, bringing its year-to-date return to 23.18%. Strong equity market returns following September’s drawdown carried into the beginning of November. The equity market climbed 2.26% from the beginning of the month through November 18, hovered near all-time highs, then experienced a -2.89% return from November 18 through month-end as uncertainty surrounding a new COVID variant caused concern among investors.
U.S. macroeconomic data released in November continued to be mixed as supply chain and labor market disruptions persisted. The second estimate of Gross Domestic Product for the third quarter of 2021 showed that the U.S. grew at an annualized rate of 2.1%, which matched the consensus expectation. The unemployment rate was better than the consensus estimate as it declined from 4.8% in September to 4.6% in October while the participation rate held steady at 61.6%. Once again, inflation outpaced the consensus estimate as the October Consumer Price Index, released on November 10, showed a 6.2% year-over-year increase – the largest increase in more than 30 years. Third quarter aggregate operating earnings were on track to climb more than 8% quarter-over-quarter while increasing nearly 54% year-over-year. With over 96% of companies reporting, more than 83% met or exceeded analyst estimates.
Implied volatility, as measured by the Cboe® Volatility Index (the VIX®), averaged 18.50 in November. Consistent with its typical relationship, average implied volatility exceeded realized volatility, as measured by the standard deviation of daily returns for the S&P 500® Index, which was 12.89% for the month. November’s more than five-percentage-point spread between S&P 500® Index realized volatility and average implied volatility, often referred to as the Volatility Risk Premium, continued the 14-month trend of readings that have been above the historical monthly average of 4.1%. The VIX® opened November at 16.41 and reached an intra-month low of 15.10 on November 3 before climbing to an intra-month high of 28.62 on November 26. The VIX® closed the month at 27.19.
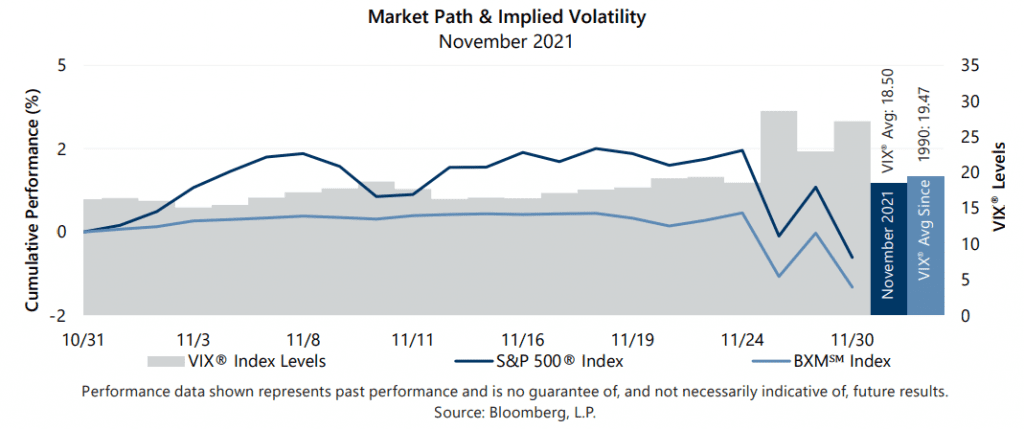
The Cboe® S&P 500 BuyWriteSM Index1 (the BXMSM) returned -1.50% in November, underperforming the S&P 500® Index by 81 basis points (bps) and bringing its year-to-date return to 16.10%. The BXMSM provided downside protection during November’s end-of-month drawdown, but the premium collected in October was insufficient to keep pace during the equity market’s advance over the first half of November. On the third Friday of each month, the BXMSM writes a new index call option as the option it wrote the previous month expires. The premiums the BXMSM collects on its written index call options have significant influence on its return potential during market advances and help to mitigate market declines. Remaining time premium from the call option written in October was insufficient in helping the BXMSM keep pace with the equity market’s rapid advance in the beginning of November. From the beginning of the month through November 18, the intra-month equity market peak and the day prior to the expiration of its written call option, the BXMSM returned 0.50% while the S&P 500® Index returned 2.26%. On November 19, the BXMSM wrote a new index call option with a December expiration and collected a premium of 1.44%. Earning a portion of the premium it received helped the BXMSM provide 90 bps of downside protection relative to the S&P 500® Index over the remainder of the month. The BXMSM returned -1.99% from its closing value on November 18 through month-end, relative to the -2.89% return of the S&P 500® Index over the same period.
The Bloomberg U.S. Aggregate Bond Index returned 0.30% in November, bringing its year-to-date return to -1.29%. The yield on the 10-year U.S. Treasury Note (the 10-year) started November at 1.56%, touched an intra-month low of 1.44% on November 9, then rose to an intra-month high of 1.67% on November 23. The yield on the 10-year then drifted back to its intra-month low of 1.44% to close the month.
1The BXMSM is a passive total return index designed to track the performance of a hypothetical buy-write strategy on the S&P 500® Index. The construction methodology of the index includes buying an equity portfolio replicating the holdings of the S&P 500® Index and selling a single one-month S&P 500® Index call option with a strike price approximately at-the-money each month on the Friday of the standard index-option expiration cycle and holding that position until the next expiration.
Sources: Morningstar DirectSM, Bloomberg, L.P. Performance data shown represents past performance and is no guarantee of, and not necessarily indicative of, future results.
For more information and access to additional insights from Gateway Investment Advisers, LLC, please visit www.gia.com.