The S&P 500® Index returned 0.43% in May, bringing its year-to-date return to 9.65%. Investors were forced to wade through simmering stress within regional banks as First Republic was seized and sold at the beginning of May. Some hoped this pressure would provide a signal to the Federal Reserve (the Fed) that they could end, or even reverse, their current interest rate hiking cycle. With a 25-basis point (bps) hike and language that had only softened slightly, their commitment to bringing inflation down to tolerable levels seemed resolute.
Macroeconomic data released in May showed that the Fed’s efforts have resulted in small but promising signs of progress even alongside a resilient U.S. labor market. The second estimate of Gross Domestic Product for the first quarter of 2023 showed that the U.S. continued to grow at a rate of 1.3%, above the consensus expectation of 1.1%. The April unemployment rate of 3.4% was a decline from the prior month and better than the consensus estimate, while the participation rate ticked up to 62.6%. While remaining well above normal levels, the March Consumer Price Index, released May 10, showed a year-over-year increase of 4.9%, lower than the prior month and slightly below the consensus expectation of 5.0%. First quarter aggregate operating earnings were on track to increase 2.0% quarter-over-quarter while decreasing -4.4% year-over-year. With over 92% of S&P 500® Index companies reporting, almost 80% have met or exceeded analyst estimates.
Implied volatility, as measured by the Cboe® Volatility Index (the VIX®), averaged 17.64 in May. Consistent with its typical relationship, average implied volatility exceeded realized volatility, as measured by the standard deviation of daily returns for the S&P 500® Index, which was 12.84% for the month. The 4.80 percentage-point spread between realized volatility and average implied volatility marks the second consecutive month above the 4.1% historical average spread between the two statistics. The VIX® ended April at 15.78, reached an intra-month high of 20.09 on May 4, then drifted to an intra-month low of 16.05 on May 18. The VIX® closed the month at 17.94.
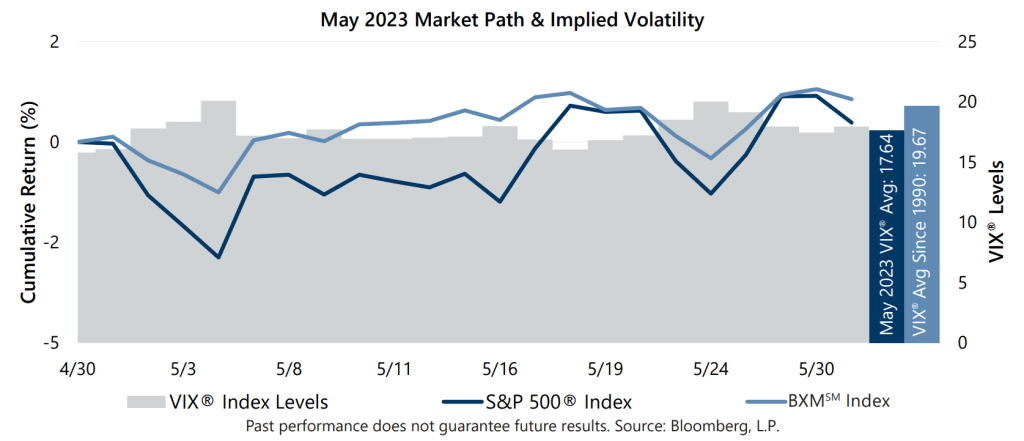
The Cboe® S&P 500 BuyWriteSM Index1 (the BXMSM) returned 0.96% in May, bringing its year-to-date return to 8.20%. The BXMSM provided 145 bps of downside risk mitigation during the brief equity market decline from the end of April to May 4 with a return of -1.13% compared to the S&P 500® Index return of -2.58%. On the third Friday of each month, the BXMSM writes a new index call option as the option it wrote the previous month expires. The premiums the BXMSM collects on its written index call options have significant influence on its return potential during market advances and help to mitigate market declines. The BXMSM began the month with an in-the-money written index call option due to the market advance at the end of April, leading to relatively low market exposure during the early-May drawdown. The combination of reduced market exposure and remaining time premium to earn from its in-the-money index call option helped the BXMSM outpace the S&P 500® Index from the beginning of the month through May 18, the day prior to the expiration of its written call option. The BXMSM returned 1.10% during this period compared to the 0.82% return of the S&P 500® Index. On May 19, the BXMSM wrote a new index call option with a June expiration and collected a premium of 1.38%. Earning a portion of the premium it received contributed to the return of the BXMSM over the remainder of the month. From its closing value on May 18 through month-end, the BXMSM returned -0.14% while the S&P 500® Index returned -0.38%.
The Bloomberg U.S. Aggregate Bond Index returned -1.09% in May, bringing its year-to-date return to 2.46%. The yield on the 10-year U.S. Treasury Note (the 10-year) ended April at 3.42% before dropping to its intra-month low of 3.34% on May 3. The yield on the 10-year then climbed to an intra-month high of 3.82% on May 25, before ending the month at 3.64%. Throughout May, the yield on the 2-year U.S. Treasury Note exceeded that of the 10-year, an inversion of its typical relationship that began on July 5, 2022.
1The BXMSM is a passive total return index designed to track the performance of a hypothetical buy-write strategy on the S&P 500® Index. The construction methodology of the index includes buying an equity portfolio replicating the holdings of the S&P 500® Index and selling a single one-month S&P 500® Index call option with a strike price approximately at-the-money each month on the Friday of the standard index-option expiration cycle and holding that position until the next expiration.
Sources: Morningstar DirectSM, Bloomberg, L.P. Performance data shown represents past performance and is no guarantee of, and not necessarily indicative of, future results.
For more information and access to additional insights from Gateway Investment Advisers, LLC, please visit www.gia.com.