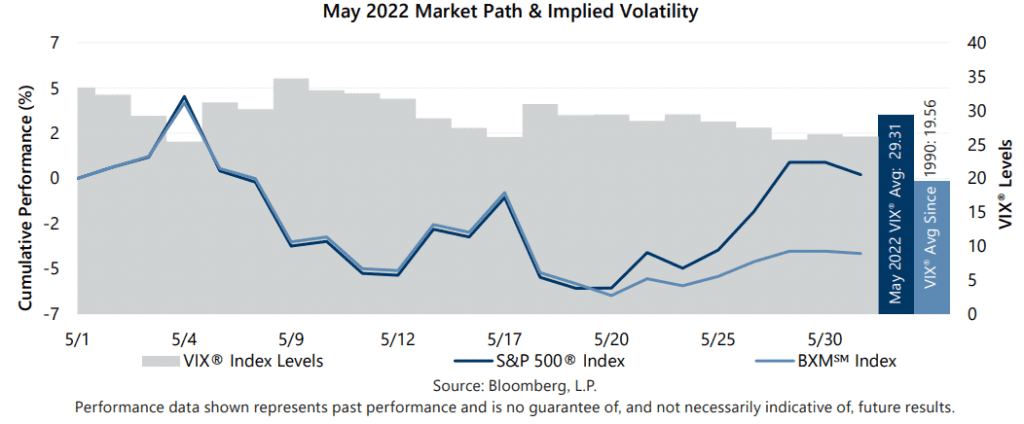
The S&P 500® Index returned 0.18% for the month of May, bringing its year-to-date return to -12.76%. The slightly positive monthly return of the equity market masked significant volatility experienced during a month in which the equity market fell into bear market territory on an intra-day basis. Market losses in the first three weeks of the month were driven by increasing concern about whether monetary policy can tame inflation without tipping the economy into recession. The S&P 500® Index reached a new year-to-date low on May 19, resulting in a loss of 18.20% from its 2022 peak on January 3. From May 4 to May 19, the S&P 500® Index declined 9.17%. The S&P 500® Index reversed course from May 19 through month-end with an advance of 5.98%.
U.S. macroeconomic data released in May continued to reflect the impact of persistent record-high inflation and the growing headwinds facing the economy. The second estimate of Gross Domestic Product for the first quarter of 2022 showed that the U.S. contracted by an annualized rate of 1.5%, slightly worse than the consensus expectation of a 1.3% contraction for the quarter. The unemployment rate was in line with the consensus estimate, holding steady at 3.6% from March to April, while the participation rate ticked down to 62.2%. The April Consumer Price Index, released May 11, continued its record-breaking streak with a year-over-year increase of 8.3% which was above the consensus expectation. First quarter aggregate operating earnings were on track to climb just 1.0% quarter-over-quarter while increasing nearly 40% year-over-year. With nearly 97% of companies reporting, over 80% met or exceeded analyst estimates.
Implied volatility, as measured by the Cboe® Volatility Index (the VIX® ), averaged 29.31 in May. In a reversal of its typical relationship, realized volatility reached 31.24% for the month – as measured by the standard deviation of daily returns for the S&P 500® Index – and exceeded average implied volatility for the period. The breakdown of the typical relationship between implied versus realized volatility occurred as the S&P 500® Index selloff intensified during May, which was the second month in a row that realized volatility exceeded implied volatility. The VIX® opened May at 32.34, reached an intra-month low of 25.42 on May 4, then climbed to an intra-month high of 34.75 on May 9. The VIX® ended the month at 26.19.
1The BXMSM is a passive total return index designed to track the performance of a hypothetical buy-write strategy on the S&P 500® Index. The construction methodology of the index includes buying an equity portfolio replicating the holdings of the S&P 500® Index and selling a single one-month S&P 500® Index call option with a strike price approximately at-the-money each month on the Friday of the standard index-option expiration cycle and holding that position until the next expiration.
Sources: Morningstar DirectSM, Bloomberg, L.P. Performance data shown represents past performance and is no guarantee of, and not necessarily indicative of, future results.
For more information and access to additional insights from Gateway Investment Advisers, LLC, please visit www.gia.com.