If there was ever a true statement, it would be that change is constant. In 2020, after years of easy money, strong equity markets and low volatility, investors awoke to a starkly different market horizon filled with constant and extraordinary headwinds that seemed to come from all directions.
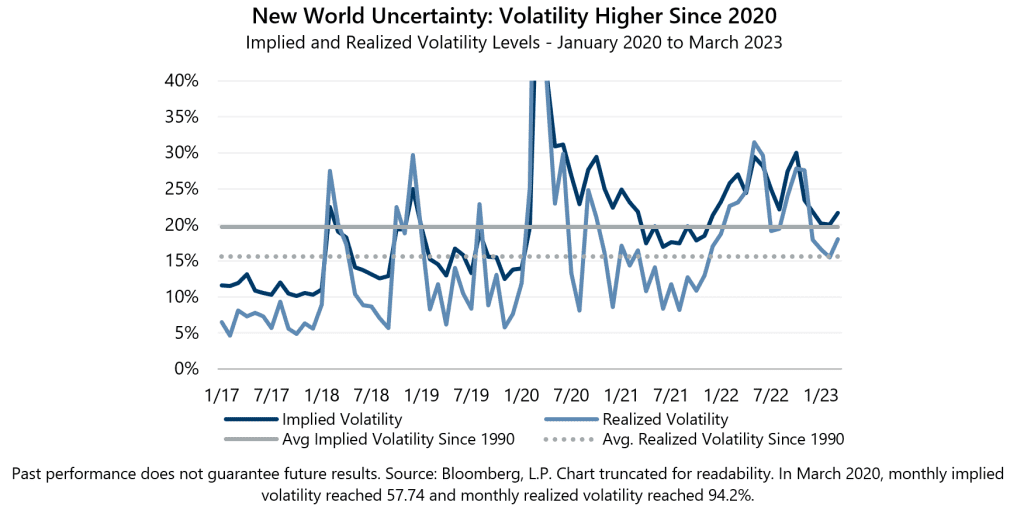
This new world of uncertainty can be seen through a shift higher in volatility levels. In the three years prior to 2020, monthly implied volatility, as measured by the Cboe® Volatility Index (the VIX®), only rose above its since-1990 average of 19.7 twice, or just 6% of the time. Monthly realized volatility, as measured by the standard deviation of daily returns for the S&P 500® Index, was also low. In the same three-year time period, realized volatility only rose above its since-1990 average of 15.6% eight times, just 22% of the time.
Contrast that data with the set from 2020 through March 2023, during which time uncertainty has seemed certain. Implied volatility has surpassed its long-term average 31 times, an eye-opening 79% of the time, while realized volatility has exceeded its long-term average 25 times, or 64% of the time.
In March, implied volatility averaged 21.64 and, consistent with its typical relationship, exceeded realized volatility of 18.03% for the month. The VIX® ended 2022 at 21.67 before declining to a first quarter low of 17.87 on February 1. A whiff of banking crisis led the VIX® to an intra-quarter high of 26.52 on March 13 – its highest level since October 2022 – before closing the quarter at 18.70.
Strategies that generate cash flow through monetizing volatility, such as Gateway’s, can assist investors during periods of uncertainty by offering a lower risk means to participate in equity markets. Strategies that employ index option writing can benefit from higher levels of implied volatility, creating the potential to generate attractive risk-adjusted returns over the long-term.