The S&P 500® Index returned 7.50% in the first quarter of 2023 with monthly returns of 6.28%, -2.44% and 3.67% for January, February and March, respectively. Persistently high inflation showed signs of softening in January and fueled optimism that the Federal Reserve (the Fed) would take a less-hawkish tone and slow the pace of monetary tightening. From the start of January through February 2, the S&P 500® Index climbed 8.98%. Euphoria turned to despair as strong macroeconomic data led the Fed to underline a commitment to raising interest rates in an effort to tame record inflation. Potential economic effects of Fed actions are yet to be fully seen, but it has devalued fixed income securities and, paired with significant depositor withdrawals in March, led to the collapse of several banks. The S&P 500® Index returned -7.53% from February 2 to March 13. Emergency measures to mitigate failing confidence in the financial system and a reversion to expecting a less-hawkish Fed in wake of the banking crisis led the equity market to advance 6.67% from March 13 through quarter-end.
Data released in March showed a steady but potentially cooling U.S. economy. The third estimate of Gross Domestic Product for the fourth quarter of 2022 showed that the U.S. continued to grow by an annualized rate of 2.6%, slightly below the consensus expectation of 2.7% and trending down from initial estimates in January. The February unemployment rate of 3.6% was an increase from the prior month and worse than the consensus estimate, while the participation rate ticked up to 62.5%. The February Consumer Price Index, released March 14, showed a year-over-year increase of 6.0%, matching the consensus expectation. Fourth quarter aggregate operating earnings were on track to decline over 3% quarter-over-quarter while decreasing more than 5% year-over-year. With over 99% of S&P 500® Index companies reporting, 73% met or exceeded analyst estimates.
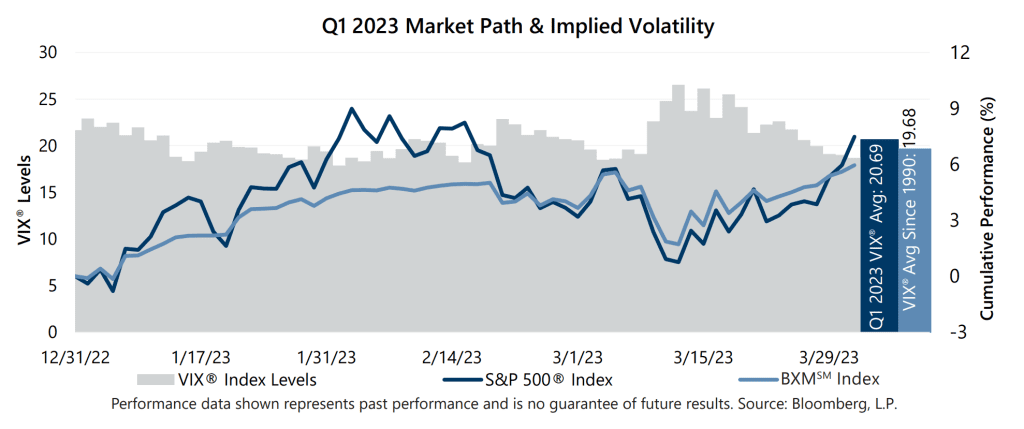
Implied volatility, as measured by the Cboe® Volatility Index (the VIX®), averaged 20.69 in the first quarter. Consistent with its typical relationship, average implied volatility exceeded realized volatility, as measured by the standard deviation of daily returns for the S&P 500® Index, which was 16.80% for the quarter. The VIX® ended 2022 at 21.67 before declining to a first quarter low of 17.87 on February 1. A whiff of banking crisis led the VIX® to an intra-quarter high of 26.52 on March 13 – its highest level since October 2022 – before closing the quarter at 18.70.
The Cboe® S&P 500 BuyWriteSM Index1 (the BXMSM) returned 5.95% in the first quarter, underperforming the S&P 500® Index by 155 basis points (bps). The BXMSM returned 4.18%, -0.16% and 1.86% in January, February and March, respectively. On the third Friday of each month, the BXMSM writes a new index call option as the option it wrote the previous month expires. The premiums the BXMSM collects on its written index call options have significant influence on its return potential during market advances and help to mitigate market declines. The above-average implied volatility during the quarter was reflected in relatively elevated premiums. The premiums the BXMSM collected as a percentage of the BXM’sSM underlying value were 2.28%, 2.08% and 2.80% in January, February and March, respectively. The passive, rules-based BXMSM entered the quarter with an out-of-the-money written index call option, resulting in relatively high market exposure. When paired with the remaining time premium from its written call option, the BXMSM returned 2.23% from the start of the year through its January 19 expiration – outpacing the 1.62% return of the S&P 500® Index. As the market continued to advance, the BXMSM entered February with an in-the-money written call option, resulting in relatively low market exposure during the first two weeks of February. This positioning, combined with premium collected from writing a new index call option with a March expiration, contributed to significant downside protection during the equity market’s mid-quarter decline. As the S&P 500® Index returned -7.53% from February 2 to March 13, the BXMSM provided 475 bps of risk mitigation with a return of -2.78%. In March, the BXMSM wrote a new index call option with an April expiration, and a portion of the premium it received contributed to the return of the BXMSM over the remainder of the quarter. From March 13 through quarter-end, the BXMSM returned 4.17% compared to the 6.67% return of the S&P 500® Index.
The Bloomberg U.S. Aggregate Bond Index returned 2.96% in the first quarter as interest rates retreated slightly in response to turmoil in the banking sector. The yield on the 10-year U.S. Treasury Note (the 10-year) ended 2022 at 3.87% before drifting to a low of 3.37% on January 18. The 10-year yield rose to an intra-quarter high of 4.06% on March 2. As banks began to collapse and hopes climbed of a pause in monetary tightening, the yield on the 10-year drifted to close the quarter at 3.47%. The yield on the 2-year U.S. Treasury Note exceeded that of the 10-year for the entire quarter, an inversion of its typical relationship that began on July 5, 2022.
1The BXMSM is a passive total return index designed to track the performance of a hypothetical buy-write strategy on the S&P 500® Index. The construction methodology of the index includes buying an equity portfolio replicating the holdings of the S&P 500® Index and selling a single one-month S&P 500® Index call option with a strike price approximately at-the-money each month on the Friday of the standard index-option expiration cycle and holding that position until the next expiration.
Sources: Morningstar DirectSM, Bloomberg, L.P. Performance data shown represents past performance and is no guarantee of, and not necessarily indicative of, future results.
For more information and access to additional insights from Gateway Investment Advisers, LLC, please visit www.gia.com.